EUR/USD stabilizes while EUR/GBP rallies and GBP/USD tumbles
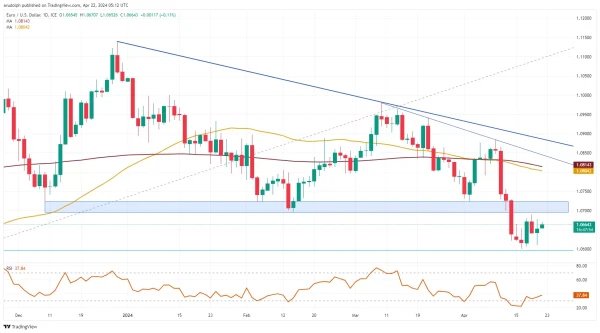
EUR/USD stabilizes
EUR/USD is now range trading between its key $1.069 to $1.0725 resistance zone and last week's $1.0601 low. Below it lies the 78.6% Fibonacci retracement of the October-to-December advance at $1.0596 and further down the late October lows at $1.0522 to $1.0517 as well as the $1.0449 October low. All of these remain medium-term in sight.
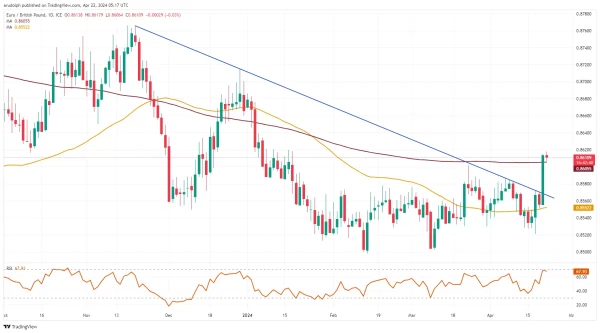
EUR/GBP sees sharp rally
EUR/GBP has swiftly risen above the 200-day simple moving average (SMA) at £0.8605 and reached the October low at £0.8617 which acts as resistance. If bettered, the £0.8630-31 mid-September high and late September low will be in focus. Slips to below the 200-day SMA should find support around the March high at £0.8602. Below it lie the 5 to 9 April highs at £0.8586-82.
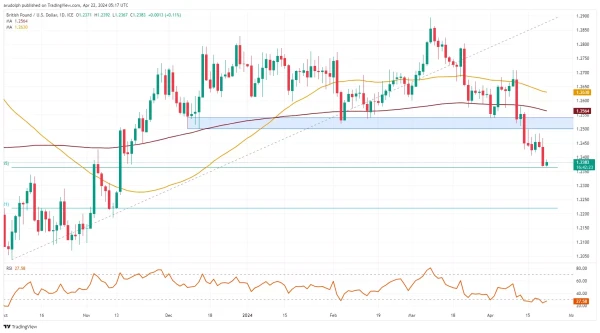
GBP/USD tumbles further
GBP/USD resumed its descent and nears the 61.8% Fibonacci retracement of the October-to-March rise at $1.2365. Further down sits the mid-October high at $1.2338. Minor resistance can be spotted at last Tuesday's $1.2406 low.