EUR/USD: trading plan for the US session on April 2nd (analysis of morning deals). Manufacturing activity in the eurozone did not help the euro
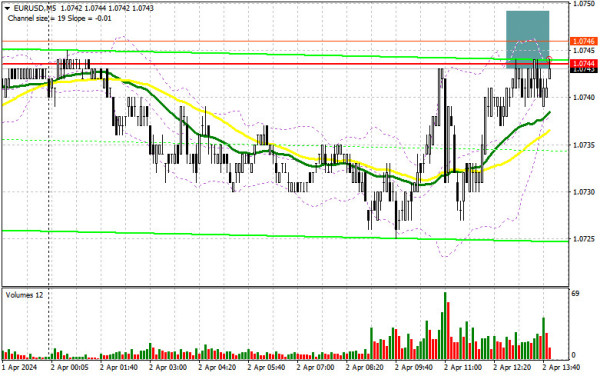
In my morning forecast, I drew attention to the level of 1.0744 and planned to make decisions based on it for market entry. Let's look at the 5-minute chart and figure out what happened there. Growth and the formation of a false breakout after the Eurozone data led to a signal to sell the euro, but as you can see on the chart, the pair did not move down, so I decided to exit the market and reassess the technical picture for the second half of the day.
For opening long positions on EUR/USD:
The Eurozone manufacturing activity data turned out to be slightly better than economists' forecasts, which led to a small increase in the euro in the first half of the day. However, the fact that activity continues to decline, especially in Germany, prevented a larger upward correction in the pair. In the second half of the day, we await data on changes in manufacturing orders, the level of vacancies, and labor turnover from the Bureau of Labor Statistics, as well as speeches by FOMC members Michelle Bowman, John Williams, and Loretta Mester, advocating for a restraining and restrictive policy, which may help the dollar strengthen its position. Strong US data, capable of exceeding economists' forecasts, will also put pressure on the pair, so I will act on the decline and the formation of a false breakout around the new support level of 1.0710. Only this will be a suitable option for long positions in anticipation of a correction to around 1.0752, where the moving averages, favoring sellers, are located. A breakthrough and renewal above this range will lead to the pair strengthening, with a chance of a surge to 1.0783. The ultimate target will be the maximum of 1.0826, where I will take profit. In the case of further decline in EUR/USD and lack of activity around 1.0710 in the second half of the day, pressure on the euro will only intensify, leading to further decline with the prospect of updating to 1.0668. I plan to enter the market there only after the formation of a false breakout. I will open long positions on a rebound from 1.0642 with a target of a 30-35 point upward correction within the day.
For opening short positions on EUR/USD:
Euro buyers failed to show anything in the first half of the day and so far are not making any significant attempts to regain control. In the event of an attempt to rise after the release of weak US data, the formation of a false breakout around 1.0752 will prove the presence of large sellers in the market and provide another entry point for short positions, with the prospect of updating the new support at 1.0710. A breakout and consolidation below this range, as well as a reverse test from bottom to top, will provide another selling point with the pair's collapse to around 1.0668, where buyers will start to act more actively. The ultimate target will be a minimum of 1.0642, where I will take a profit. In the event of an upward movement of EUR/USD in the second half of the day, as well as the absence of bears at 1.0752, buyers will have a chance for a small upward correction. In this case, I will postpone sales until testing the next resistance at 1.0783. I will also sell there, but only after an unsuccessful consolidation. I plan to open short positions immediately on a rebound from 1.0826 with a target of a downward correction of 30-35 points.
Indicator Signals:
Moving Averages
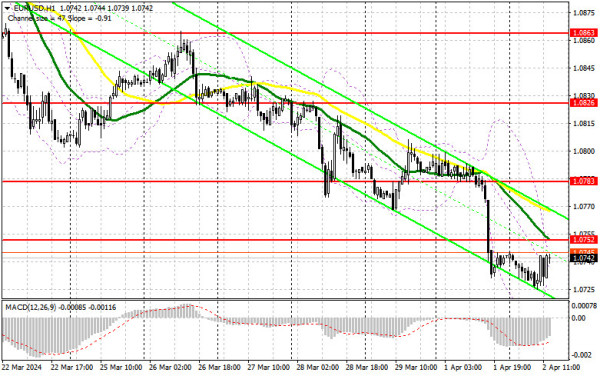
Trading is carried out below the 30 and 50-day moving averages, indicating a decline in the euro.
Note: The period and prices of moving averages are considered by the author on the H1 hourly chart and differ from the general definition of classic daily moving averages on the D1 daily chart.
Bollinger Bands
In the event of a decline, the lower boundary of the indicator, around 1.0730, will act as support.
Description of Indicators:
• Moving average (determines the current trend by smoothing volatility and noise). Period 50. Marked on the chart in yellow.
• Moving average (determines the current trend by smoothing volatility and noise). Period 30. Marked on the chart in green.
• MACD indicator (Moving Average Convergence/Divergence). Fast EMA period 12. Slow EMA period 26. SMA period 9.
• Bollinger Bands. Period 20.
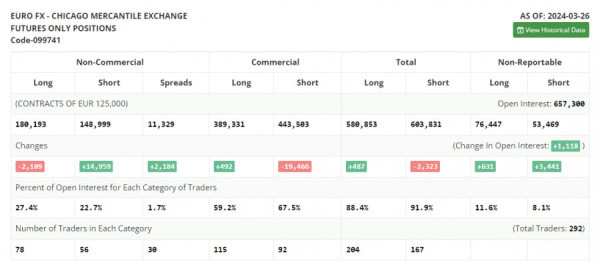
• Non-commercial traders - speculators, such as individual traders, hedge funds, and large institutions, using the futures market for speculative purposes and meeting certain requirements.
• Long non-commercial positions represent the total long open position of non-commercial traders.
• Short non-commercial positions represent the total short open position of non-commercial traders.
• The total non-commercial net position is the difference between the short and long positions of non-commercial traders.