FTSE 100 Forecast: Reaches Previous Range Again
- In my daily analysis of the FTSE 100, the first thing I noticed is that we are getting a bit overstretched.
- As we reach the 8,350 level, we are running into a previous resistance barrier, and at the same time, we have had multiple candlesticks in a row that were positive.
- Sooner or later, there has to be a little bit of a pullback in order to attract more buyers at the very least.
It's also worth noting that the stochastic oscillator is starting to cross in an extreme overbought condition, so I think it's probably only a matter of time before we do get a little bit of a pullback. That being said, the 50-day EMA currently sits right around the 8200 level, and the 8200 level, of course, is a large round, psychologically significant figure that will attract a certain amount of attention. However, stock markets don't necessarily always take a break and now we have to look at this through the prism of what happens if we really do take off to the upside. A move above the 8,400 level almost certainly opens up the possibility of a move towards the 8,470 level, which was near the recent highs. While I would prefer a little bit of a pullback in order to start buying, the reality is sometimes the market just takes off.
Top Forex Brokers
1Look for Value
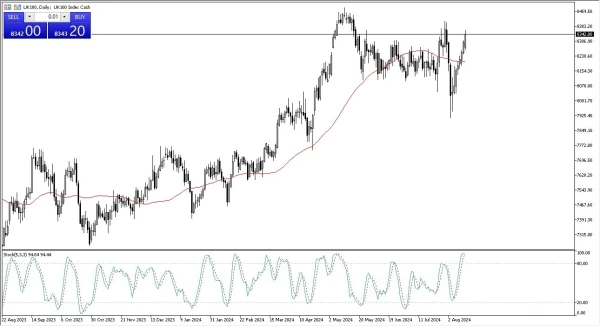
Regardless, I think this is a market that you're looking for value, and you don't necessarily want to jump into the market all the way up here with a huge position. The trend had been bullish for quite some time. And as we started to head into spring and summer, the market has essentially gone sideways with the exception of that little bit of a flash crash about 15 days ago in global markets. not just London. So, I think at this point in time, we're just simply trying to recapture where we once were.
Ready to trade the daily analysis & predictions? We’ve made a list of the best online CFD trading brokers worth trading with