FX Watch: US dollar on watch, AUD/JPY continues to climb
Volatile month of August rounded off with some calm
Wall Street managed to move higher with ease to end last week, as traction returned to the growth sectors on Friday, with questions on whether Nvidia’s sell-off has been an overreaction. Overall, there have not been much to challenge the current market optimism around soft landing hopes and upcoming Federal Reserve (Fed)’s policy easing, with the lower-than-expected US core Personal Consumption Expenditures (PCE) price index on Friday offering yet another inflation calm.
Chatters have now surfaced around the weak seasonality for equities for the month of September, but generally the early half of the month tends to see strong gains before paring towards the end. Attention this week will fall on a series of economic data, ranging from US Purchasing Managers' Index (PMI) numbers to the all-important US non-farm payroll report, to help resolve the debate between a 25 basis point (bp) and a 50 bp cut for the upcoming Fed meeting.
The “good news is good news” mantra will likely be in play, and with US unemployment rate (4.3%) already pushing past the Fed’s own economic projections for 2025 and 2026, market participants will want to see a more tame read (expected 4.2%) to downplay hard landing risks and offer more stability to the risk rally.
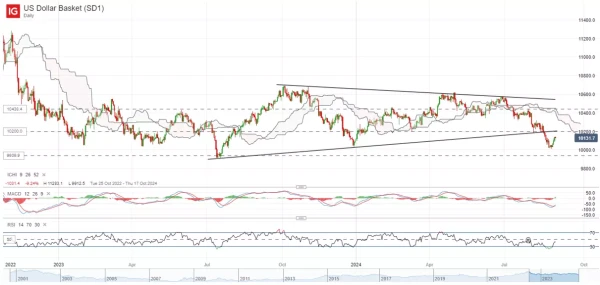
US dollar index: Stage a near-term bounce but much awaits
The US dollar managed to regain some footing following its previous sell-off, gaining 1.3% over the past week after nearing the lower range of its broad consolidation pattern at the 100.32 level. A break below a wedge formation may still be significant, which will leave the lower trendline at the 102.00 level on watch as a key previous support-turned-resistance to overcome.
For now, its daily relative strength index (RSI) has eased off previous oversold territory, but until it manages to push above the mid-line, it may be too early to call for a reversal. On the downside, the recent low at the 100.32 level will be near-term support to watch, with any failure to hold ahead likely to pave the way towards the July 2023 bottom next.
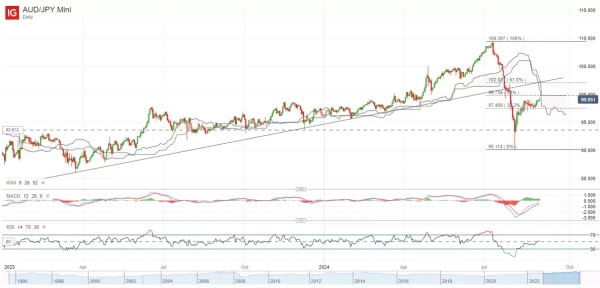
AUD/JPY: How far can it climb?
The AUD/JPY has recovered strongly from its 5 August dip thus far, gaining more than 10% over the past month. The push to a new near-term higher high seems to suggest that the bulls remain in near-term control, as the daily RSI eye for a move back above its mid-line. That said, it is nearing the next level of resistance could be at the 99.75 level, which could find some selling pressures from a 50% retracement level and its daily Ichimoku Cloud.
Recent upmove also seems to mark a detach from the narrowing of Australia-Japan bond yield differentials, which may eventually limit the pair’s upside if the trend continues. Any move above the 99.75 level could leave the 102.03 level on watch next, where a stronger resistance confluence stands from an upward trendline resistance.