FX Watch: USD/JPY punches below trendline support, EUR/GBP firms
Round-up
A significant miss in the US July job data added to calls of a hard landing, paving the way for another round of unwinding in US equities to end last week. US job additions came in at 114,000, below the 175,000 consensus, while unemployment rate headed to 4.3% from previous 4.1%, reflecting more severe cracks in US labour conditions. That was sufficient to drive market pricing for a more aggressive Federal Reserve (Fed)’s easing cycle to support growth, with consensus leaning towards a 50 basis point (bp) in September and cumulative 125 bp worth of rate cuts by the end of this year.
Whether the recent market sell-off is an overreaction may boil down to the US Institute for Supply Management (ISM) services Purchasing Managers' Index (PMI) release later today. Expectations are for July services activities to revert to expansion at 51.0 from the 48.8 prior, which may offer some calm to growth jitters if it materialises. With the Fear & Greed Index coming in at its lowest level since October 2023, one to watch for any dip in “extreme fear” territory, which is generally met with a near-term bounce on past occasions.
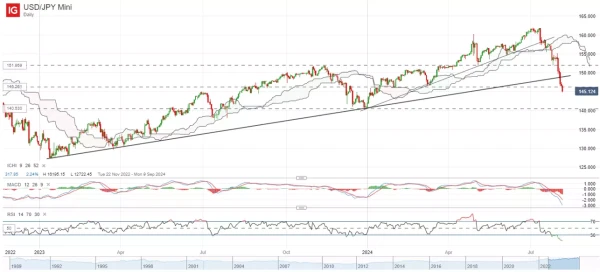
USD/JPY punches decisively below trendline support
The sell-off in USD/JPY extends into today’s session, with the pair breaking below a key upward trendline decisively at the 148.80 level last week, pointing to strong selling pressures in place as the favoured carry trade for Japanese yen unwinds further.
While near-term extreme oversold technical conditions may call for some calm, intermittent attempts to bounce for the pair within the four-hour timeframe have been short-lived, while the trendline breakdown may point to a broader downward bias at play. Further downside may leave the 140.53 level on watch next, while any attempt to stabilise may likely face a crucial test at the 145.00 level, where the upward trendline may now serve as a key hurdle to overcome.
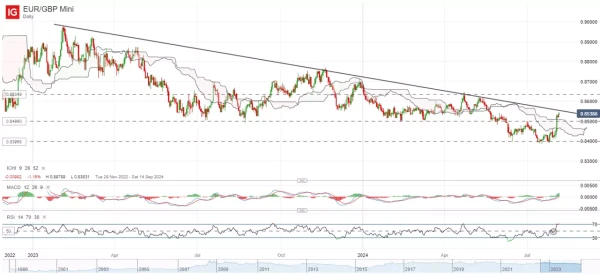
EUR/GBP eyeing retest of trendline resistance
With the Bank of England (BoE) joining the ranks of global central banks in cutting rates last week, the EUR/GBP is finding room for a bounce lately, with the pair edging closer to a downward trendline resistance at the 0.856 level.
Buyers seem to be taking near-term control, with its daily relative strength index (RSI) edging back above the mid-line for the first time since May this year, along with a crossover in its daily moving average convergence/divergence (MACD) into positive territory. Any move above the 0.856 level may pave the way for the pair to head towards the 0.863 level next, followed by the 0.876 level.