GBP/JPY: outlook on September 3
Monthly chart
The GBP/JPY pair bounced strongly from a strong supply area as soon as it was touched. It is expected that a small correction will occur to fill the imbalance and then, the instrument will continue the decline because the general trend is bearish and there is no reason for the pair to rise. However, if it rises, it will aim to break the peak that it had previously formed. Then, the price will fall after that.
Weekly chart
The weekly time frame supports the decline from the order block at the level of 197.315 because there is a trend line liquidity that will target it after the instrument reaches the order block, but GBP/JPY might not reach this level and will decline directly. So, we may look for other areas to enter on the lower time frames.
Daily chart
Indeed, there is a better zone to open sell positions on the daily time frame, which is at 195.95. What supports this area is the 61.8 Fibonacci level there, but this level is in the middle of the order block, though it is still an important level. So, if you want to wait for the price to reach this level and open sell positions when an entry signal is formed, you can do that and that is much better.
4-hour chart
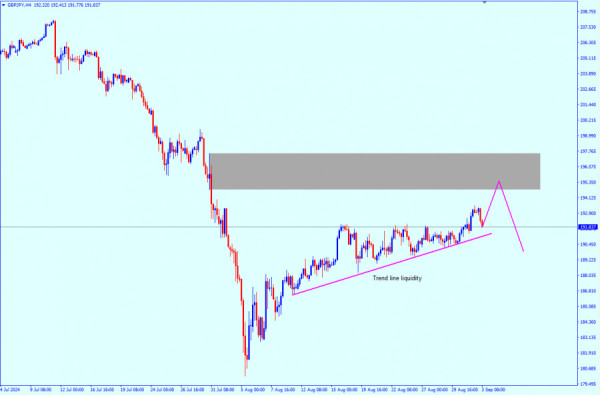
There is a good area for those who want to enter a trade at present from the current levels in the four-hour timeframe at 191.800. This level meets an internal bullish trend line, but this trend will not be broken now because the price aims first to rise and touch the order block at the level of 195.36. Then, it will fall after that, but it is possible that it will rise more than that to target the daily order block. Anyway, it will be within the four-hour range as well.
Points of interest (POI)
Buy from: 191.800 (the current level)
TP1: 193.48 (first structure point)
TP2: 195 (within the order block range)
Stop loss: 191 (below the bearish trendline)
If the downtrend is broken, the instrument will fall lower and will not rise to the order block areas mentioned.