GBP/USD find support while EUR/JPY, USD/JPY try to break through resistance
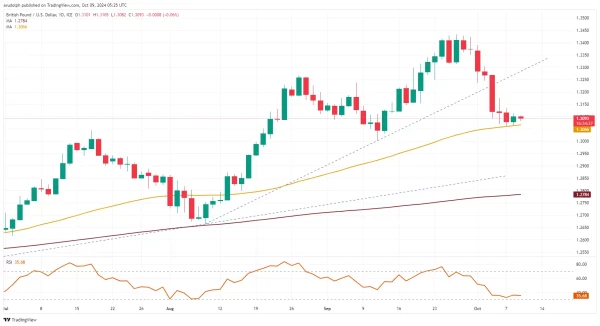
GBP/USD finds support
GBP/USD dropped to the 55-day simple moving average (SMA) at $1.3066 which acted as support and so far held. Were it to give way, the September low at $1.3002 would be next in line. This support level with the $1.30 mark is key for the medium-term trend as a fall through it could lead to the 200-day SMA at $1.2784 being back in sight.
While the $1.30 mark underpins, the medium-term uptrend remains intact though. Minor resistance can be found at the early September high at $1.3239.
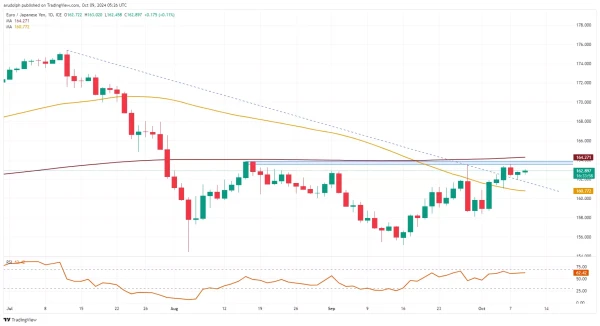
EUR/JPY ranges below resistance
EUR/JPY continues to trade below the ¥162.89-to-¥164.24 resistance area. Were it to be overcome, a medium-term bullish reversal would be formed.
Potential slips may find support between Friday's low and the 55-day SMA at ¥161.01-to-¥160.77.
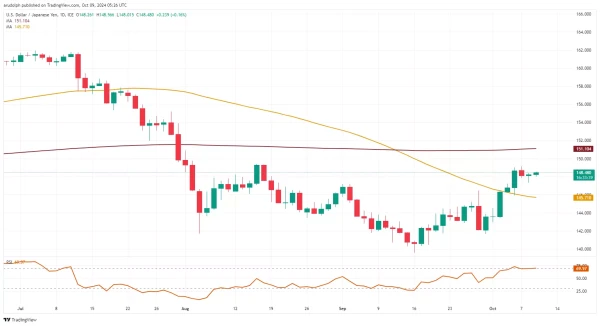
USD/JPY aims for key resistance
USD/JPY still has its mid-August high at ¥149.40 in view. A rise and daily chart close above ¥149.40 would likely lead to a medium-term bullish reversal taking shape.
Support remains to be seen between the early September high at ¥147.21, the late September high at ¥146.49 and Friday's low at ¥145.93.