GBP/USD Forex Signal: Bullish Flag Pattern Forms
Bullish View
- Buy the GBP/USD pair and set a take-profit at 1.3250.
- Add a stop-loss at 1.3100.
- Timeline: 1-2 days.
Bearish View
- Set a sell-stop at 1.3170 and a take-profit at 1.3100.
- Add a stop-loss at 1.3250.
The GBP/USD pair retreated slightly as traders reflected on last week’s dovish statement by Jerome Powell. It pulled back from Friday’s high of 1.3230 to the psychological point at 1.3200 as focus shifted to key US economic data.
Top Forex Brokers
1US Consumer Confidence Data Ahead
The US published relatively strong durable goods order data on Monday. The report revealed that the orders rose from minus 6.9% in June to 9.9% in July, higher than the expected 4.05.
However, core orders fell by 0.2% during the month after growing by 0.1% in the previous month.
The next important data to watch will be the closely-watched US consumer confidence data. Economists expect the report to show that confidence slowed from 100.3 in July to 100.2 in August.
Traders pay a close attention to consumer confidence because a higher figure is a sign that spending rose during the month.
The US will also publish the latest house price index data. The most important report will be the country’s personal consumption expenditure (PCE) data on Friday. This is a crucial figure that shows price movements in rural and urban America and is the Fed’s favorite inflation gauge.
These numbers will come a week after the Federal Reserve chair hinted that the bank will start cutting rates soon because of the deteriorating labor market. Recent data showed that the unemployment rate rose to 4.3% in July.
The GBP/USD pair also retreated as geopolitical risks rose, pushing oil prices higher. In the Middle East, there is a risk of war between Israel and Lebanon, which would lead to disruptions in the oil market. There are also concerns about the political crisis in Libya, a country that exports over 1 million barrels of oil each day.
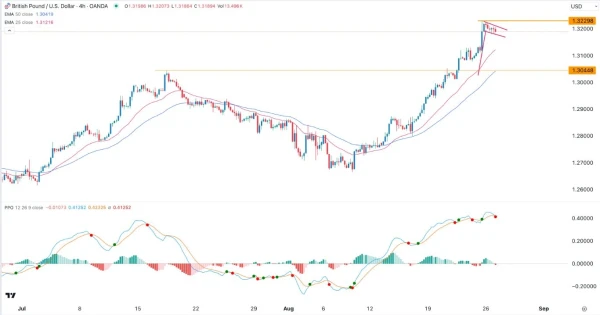
GBP/USD Technical Analysis
The GBP/USD pair has been in a strong bull run in the past few months and currently sits at its highest point in 2022. As a result, the rally has been supported by the 50-period moving average.
Most importantly, the pair has formed a bullish flag chart pattern, which is a popular continuation sign. This pattern is characterized by a long vertical line and a rectangle pattern.
The Percentage Price Oscillator (PPO) has remained above the neutral level. Therefore, the pair will likely have a bullish breakout as bulls target last week’s high of 1.3230.
Ready to trade our free daily Forex trading signals? Get the most recommended Forex broker in the UK here.