GBP/USD slips while EUR/JPY, USD/JPY probe key resistance
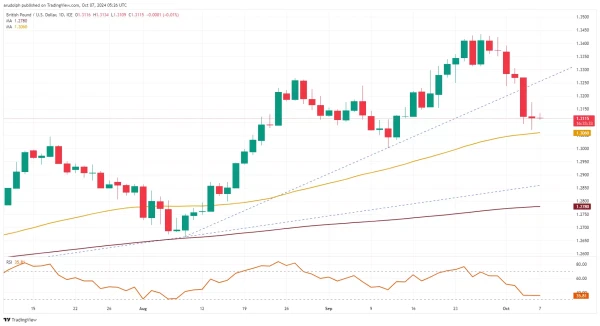
GBP/USD remains under pressure
GBP/USD has so far fallen to $1.3070, to within a whisker of the 55-day simple moving average (SMA) and the September low at $1.306-to-$1.3002. This support zone is key for the medium-term trend as a fall through it could lead to the 200-day SMA at $1.2779 being back in sight.
While the $1.30 mark underpins, the medium-term uptrend remains intact though. Minor resistance can be found at the early September high at $1.3239.
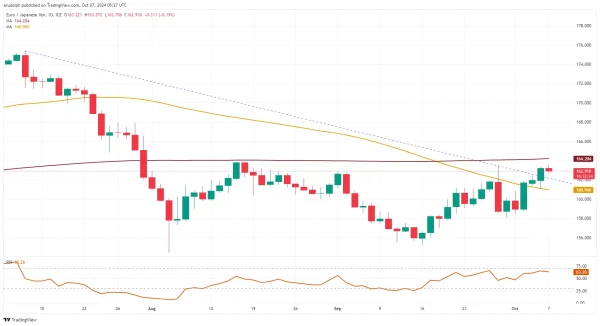
EUR/JPY encounters resistance
EUR/JPY is trying to overcome last week's ¥162.49 high but so far remains capped by the more significant ¥162.89-to-¥164.15 resistance area. Were it to be overcome, a medium-term bullish reversal would be on the cards.
Potential slips may find support between Friday's low and the 55-day SM at ¥161.01-to-¥160.96.
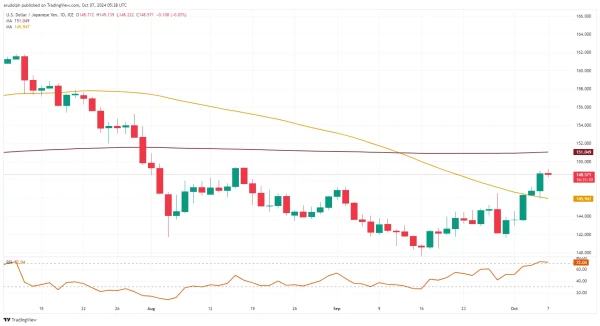
USD/JPY nears key resistance
USD/JPY has swiftly risen from its late September low at ¥141.65 low towards its mid-August high at ¥149.40. A rise and daily chart close above this level would likely lead to a medium-term bullish reversal taking shape.
Support can now be spotted between the early September high at ¥147.21, the late September high at ¥146.49 and Friday's low at ¥145.93.