GBP/USD: trading plan for the US session on April 24th (analysis of morning deals). The pound retains hope
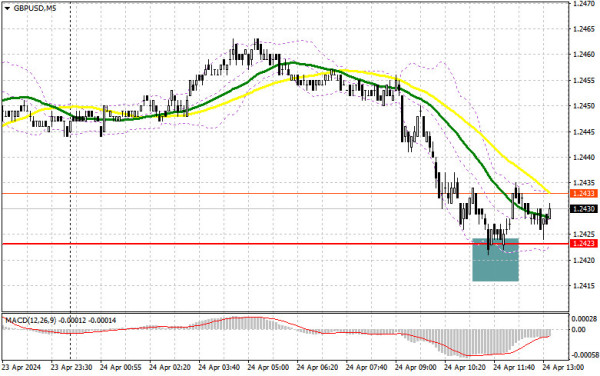
In my morning forecast, I focused on the level of 1.2423 and planned to make decisions based on it for market entry. Let's take a look at the 5-minute chart and analyze what happened there. The decline and the formation of a false breakout around 1.2423 led to a signal to buy the pound in continuation of yesterday's bullish trend. However, as you can see on the chart, a significant surge in the pair did not materialize. The technical picture remained unchanged for the second half of the day.
For opening long positions on GBP/USD:
In my forecast, I mentioned that in the absence of activity at 1.2423, it's better to refrain from buying. And that's exactly what happened: although bulls defended this range against the backdrop of the absence of important statistics, what to do next remains an open question. Ahead is only data on changes in the volume of durable goods orders in the US, so further pair decline is not ruled out - especially in the event of good statistics, which buyers of the dollar have been lacking lately. In the event of a pair decline, a lot will depend on the behavior of traders at the 1.2423 level, which has already been tested once today. Only a repeated false breakout there will provide a buying entry point with the aim of rising to the resistance at 1.2478, formed at the end of yesterday. A breakout and a test from top to bottom of this range will restore the chance for GBP/USD recovery, leading to new purchases and allowing it to reach 1.2532. If the pair breaks above this range, we can expect a surge towards 1.2575, where I plan to take profit. In the scenario of GBP/USD decline and the absence of buyers at 1.2423 in the second half of the day, which is more likely, sellers will regain control of the market, allowing for further significant pair decline along the trend. In this case, I'll look for purchases around 1.2383. The formation of a false breakout will be a suitable option for market entry. I plan to open long positions on GBP/USD immediately on the rebound from 1.2340 with the aim of a correction of 30-35 points within the day.
For opening short positions on GBP/USD:
Bears have every chance to continue the pair decline, but to do this, they need to break through 1.2423. If US data disappoints and we see an increase in GBP/USD, I'll postpone selling until testing resistance at 1.2478. A false breakout there will confirm the presence of major sellers in the market, leading to another decline in GBP/USD towards 1.2423. A breakout and a reverse test from the bottom to the top of this range will increase pressure on the pair, giving bears an advantage and another selling entry point with the aim of retesting 1.2383. The ultimate target will be at a minimum of 1.2340, where I'll take profit. In the scenario of a GBP/USD rise and the absence of bears at 1.2478 in the second half of the day, bulls will have the opportunity to continue the correction upwards towards the resistance at 1.2532. I'll also sell there only on a false breakout. In case of inactivity there as well, I recommend opening short positions on GBP/USD from 1.2575 with the expectation of a pair rebound downwards by 30-35 points within the day.
Indicator Signals:
Moving Averages:
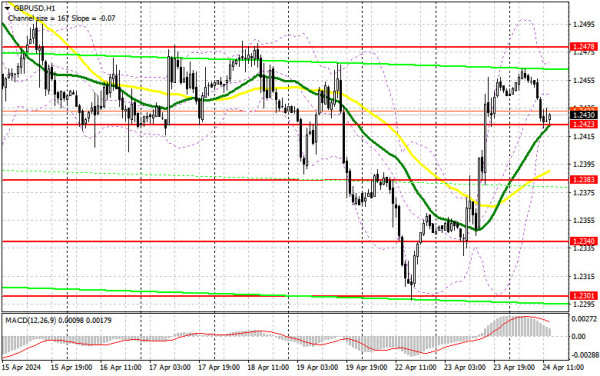
Trading is conducted below the 30 and 50-day moving averages, indicating a bearish market.
Note: The author considers the period and prices of moving averages on the hourly H1 chart, which differs from the general definition of classic daily moving averages on the daily D1 chart.
Bollinger Bands:
In case of a decline, the lower boundary of the indicator will act as support around 1.2340.
Description of Indicators:
- Moving average (determines the current trend by smoothing volatility and noise). Period 50. Marked on the chart in yellow.
- Moving average (determines the current trend by smoothing volatility and noise). Period 30. Marked on the chart in green.
- MACD indicator (Moving Average Convergence/Divergence). Fast EMA period 12. Slow EMA period 26. SMA period 9.
- Bollinger Bands. Period 20.
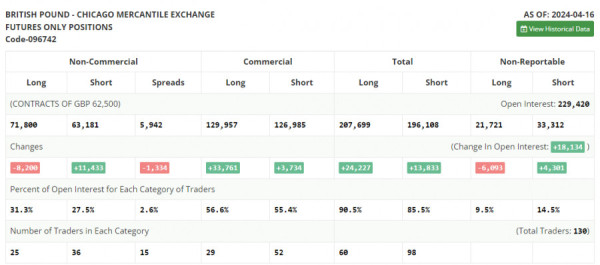
- Non-commercial traders - speculators, such as individual traders, hedge funds, and large institutions, use the futures market for speculative purposes and meet certain requirements.
- Long non-commercial positions represent the total long open position of non-commercial traders.
- Short non-commercial positions represent the total short open positions of non-commercial traders.
- The total non-commercial net position is the difference between the short and long positions of non-commercial traders.