Gold Price Forecast – A Runaway Move Could Push Gold Towards $3000 by August
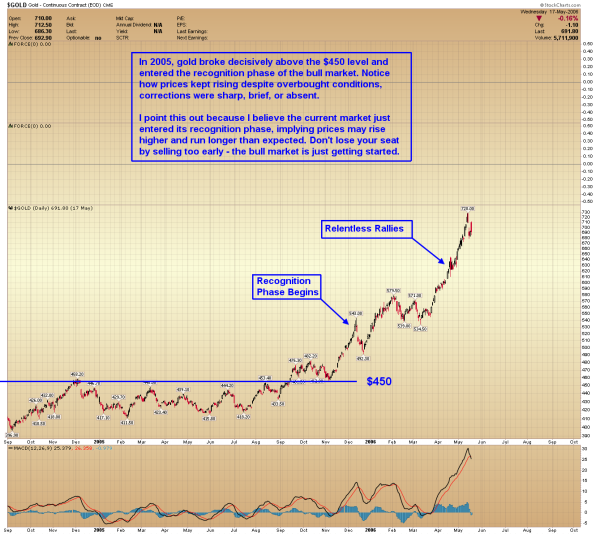
The 2005 Gold Breakout
In 2005, gold broke decisively above the $450 level and entered the recognition phase of the bull market. Notice how prices kept rising despite overbought conditions; corrections were sharp, brief, or absent.
I point this out because I believe the current market just entered its recognition phase, implying prices may rise higher and run longer than expected. Don’t lose your seat by selling too early – the bull market is just getting started.
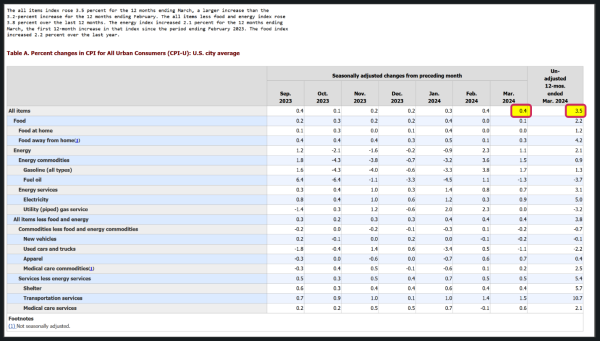
Inflation Update
CPI increased 0.4% for March and 3.5% annually. At this rate, inflation could creep back above 4% by August and maybe higher if we see crude oil spike over conflict with Iran.
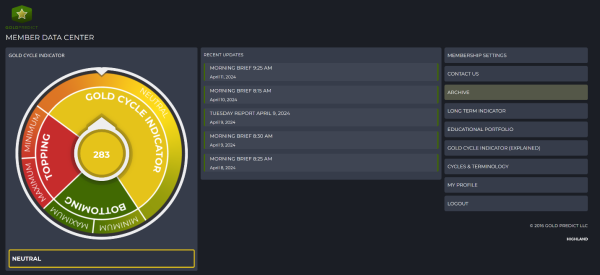
Gold Cycle Indicator
The Gold Cycle Indicator finished at 283. I’ll look to hedge positions once it enters cycle topping (red).
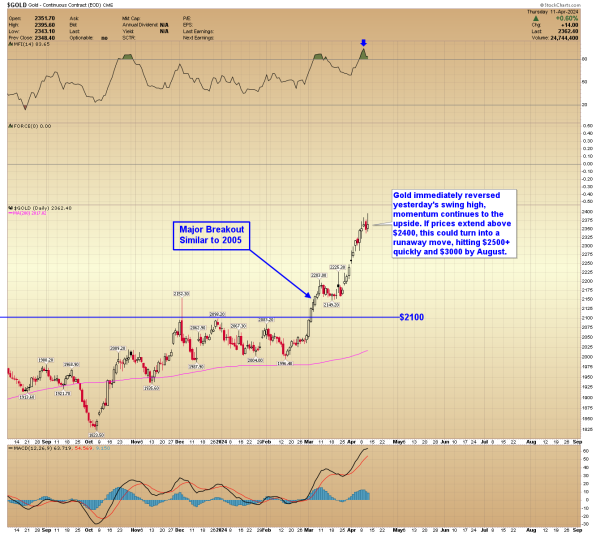
Gold
Gold immediately reversed yesterday’s swing high; momentum continues to the upside. If prices extend above $2400, this could turn into a runaway move, hitting $2500+ quickly and $3000 by August.
Silver
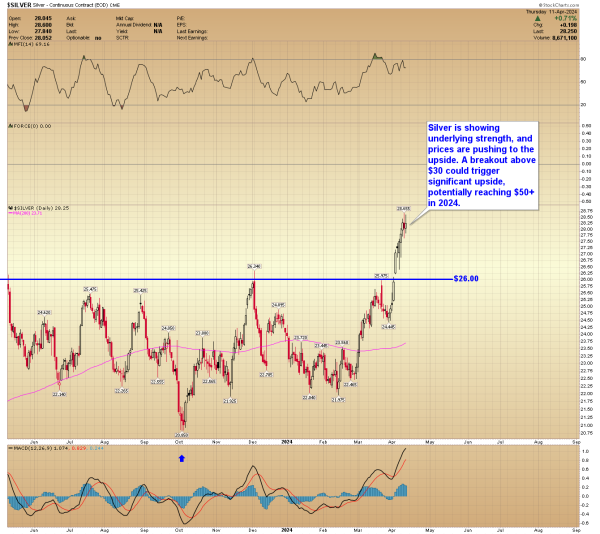
Silver is showing underlying strength, and prices are pushing to the upside. A breakout above $30 could trigger significant upside, potentially reaching $50+ in 2024.
Platinum
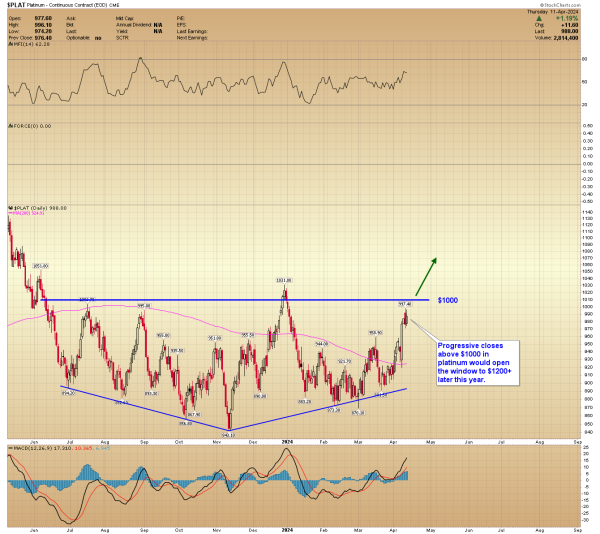
Progressive closes above $1000 in platinum would open the window to $1200+ later this year.
GDX
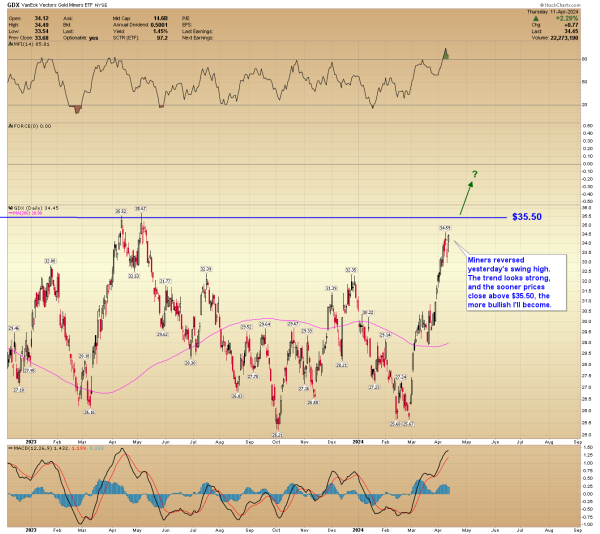
Miners reversed yesterday’s swing high. The trend looks strong, and the sooner prices close above $35.50, the more bullish I’ll become.
GDXJ
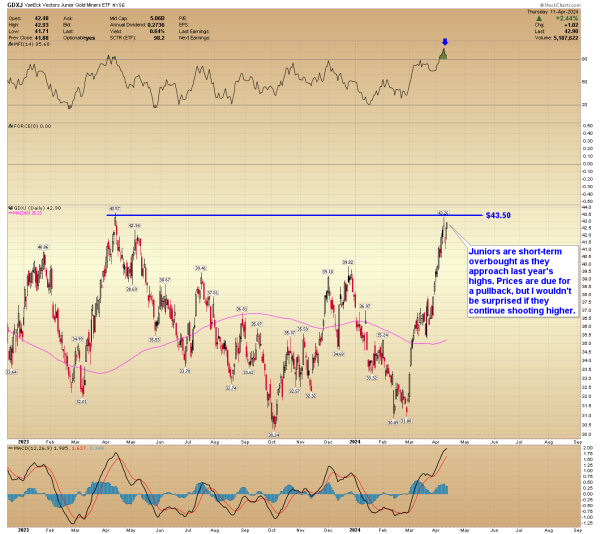
Juniors are short-term overbought as they approach last year’s highs. Prices are due for a pullback, but I wouldn’t be surprised if they continue shooting higher.
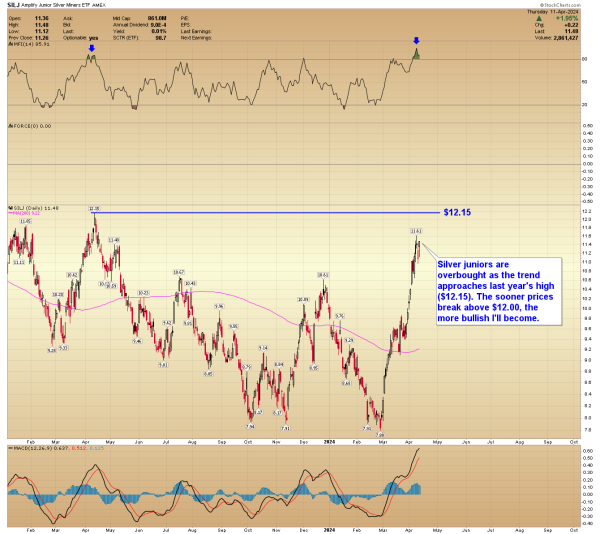
SILJ
Silver juniors are overbought as the trend approaches last year’s high ($12.15). The sooner prices break above $12.00, the more bullish I’ll become.
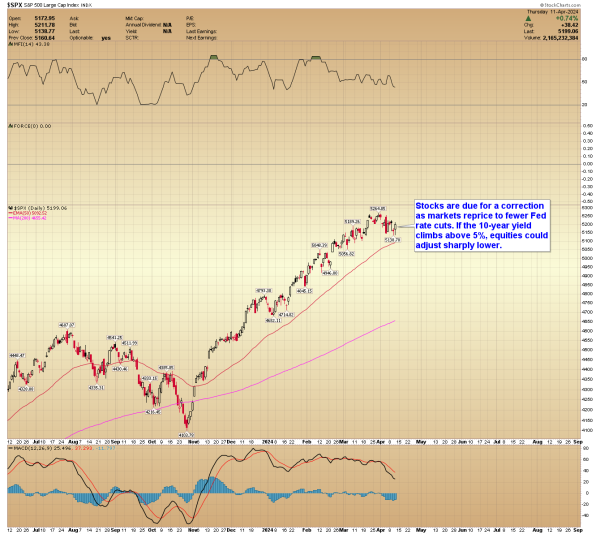
S&P 500
Stocks are due for a correction as markets reprice to fewer Fed rate cuts. If the 10-year yield climbs above 5%, equities could adjust sharply lower.
Conclusion
The next big surge in gold has started, and sub-$2000 pricing may be forever in the past. Gold miners are unloved, extremely undervalued and have a lot of potential upside in the coming months and years. Watch silver for clues.
AG Thorson is a registered CMT and an expert in technical analysis. For daily market updates, consider subscribing www.GoldPredict.com.