Gold Price Forecast: New Record High, Targets Further Gains
Gold reached a new record high of 2,532 on Tuesday before pulling back intraday. A close above the halfway point of the day’s range at 2,514 today should be a stronger indication than a daily close below it. Gold is bullish on the daily chart and higher time frames as it just broke out of a base covering several months last Friday. Today’s advance is a third day up with higher daily lows and higher daily highs, indicating the progression of an uptrend. A bullish breakout was triggered today by a rally above yesterday’s high of 2,509. Yesterday was an inside day and represented a rest and consolidation day.
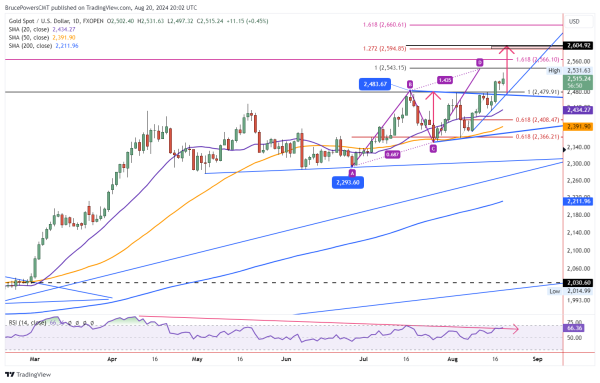
Next Target is 2,543
The day’s high of 2,532 was shy of the next higher target level at 2,543, which is an initial target from a rising ABCD pattern. Extended targets from the pattern include the 127.2% extension at 2,595, and the 161.8% extended target at 2,661. Other potential targets to watch for potential resistance on the way up include a 161.8% extended target at 2,566. That is from a long-term rising ABCD pattern that begins from the September 2022 swing low of 1,615. The second leg up begins from the October 2023 swing low.
Symmetrical Triangle Breakout Following-through
Last week’s breakout to new record highs for gold was accompanied by a breakout of a symmetrical triangle consolidation pattern. Calculating a measuring objective from the pattern provides a potential initial target of 2,605 (red arrows). That is very close to the 127.2% extended target of 2,595 and therefore they should be considered together as a price range.
Long Term Target at 2,715
Longer-term targets are higher than the 161.8% extended ABCD target at 2,661. There is a long-term target starting with 2,715. That price level is an extended retracement from the decline off the 1,921 high from September 2011. The extension is 200% of the decline. It is interesting that a long-term measured move based on percentage performance also points to that price zone giving it added potential significance. Long-term measured provide potential more significant price levels. And this makes it more likely they will eventually be encountered eventually. The long-term monthly chart is supportive of such a scenario as well.
For a look at all of today’s economic events, check out our economic calendar.