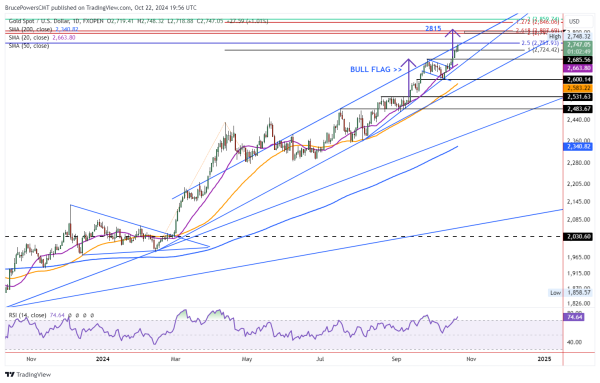
Gold Price Forecast: Strength Persists as Bull Flag Breakout Targets 2,815
Gold reached another new record high on Tuesday at 2,748. It continues to trade strong, near the highs of the day, at the time of this writing and should close strong, in the top third of the day’s trading range. Further, Monday’s high and prior record high was 2,741. Gold is trading above it at this time and if it can close above there today, that will be another sign of strength.

Continued Strength Increases Chance Flag Target Reached
A primary target for gold at 2,815 is derived from the bull flag pattern, which gold broke out of last week. Subsequently, gold is progressing as it might following such a breakout. Nonetheless, there is no assurance the 2,815 target will be hit, or the path gold might take getting there. Today, gold is flirting with potential resistance around the top line of an ascending parallel channel. It hasn’t broken through it clearly yet, which means it may yet act as a resistance area. Moreover, a decisive rally above today’s high triggers a potential upside breakout of the channel.
Next up is 2,754
A target from an extended retracement of the decline following the March 2022 peak is up next at 2,754. That target is the 250% extended retracement of the 2022 decline. It may mean something, and it may not. How the price of gold reacts around that price area should provide clues. The next higher target from that same retracement is the 261.8% extension at 2,808.
That is right in the zone for the flag target. When combined with a 200% extended target of the September 2011 decline at 2,797, a potentially significant resistance zone is indicated from 2,797 to 2,815. Since the 2,797 target is from a very long-term measurement, it may take on greater significance and should be watched closely if approached.
Near-term Support at Day’s Low of 2,719
If resistance is subsequently seen from today’s high, the low for today is potential near-term support at 2,719. If it fails to hold there is the potential to eventually test support around the 20-Day MA at 2,664, which is near the lower channel line. Nevertheless, the characteristics of the pullback should set gold up for the next advance. Strength seen recently is the bullish follow-through from a multi-year base breakout that began in February.
For a look at all of today’s economic events, check out our economic calendar.