Gold Prices Forecast: XAU/USD Hits Two-Week Low Amid Market Correction
Gold Price Trends and Economic Influence
Gold prices have recently fallen to a low not seen in over two weeks, triggered by profit-taking following easing geopolitical tensions and a preceding price rally. This drop reflects a natural market correction after a significant increase in value.
At 10:57 GMT, XAU/USD is trading $2361.095, down 22.035 or -0.92%.
Correction Phase
The current technical analysis indicates a specific support range for gold. Maintaining above this range could suggest that the recent price dip is a minor correction within an otherwise strong upward trend. Additionally, the increase in investments in gold-backed ETFs highlights a revived interest in the metal, suggesting a solid undercurrent of demand.
Impact of Economic Data and Federal Policy
This week is critical for economic data, with multiple reports scheduled that could impact Federal Reserve decisions. The focus is on indicators such as the personal consumption expenditures price index and GDP figures. These reports are crucial as they may show persistent inflationary pressures, influencing the Fed’s stance on interest rates.
Short-Term Market Forecast
The anticipation around Federal Reserve policies is a pivotal factor for gold’s price trend. If economic reports confirm a resilient economy and sustained inflation, it might lead to expectations of maintained or even higher interest rates, contrasting earlier forecasts of rate cuts. Such economic strength, coupled with a stronger dollar, may temporarily challenge gold prices.
However, the overall market sentiment towards gold remains bullish. With strong technical support and increased market entry through ETFs, gold is likely positioned for future gains. The outcome of this week’s crucial economic reports will be instrumental in shaping short-term expectations and could reaffirm gold’s upward trend in the face of temporary corrections.
Technical Analysis
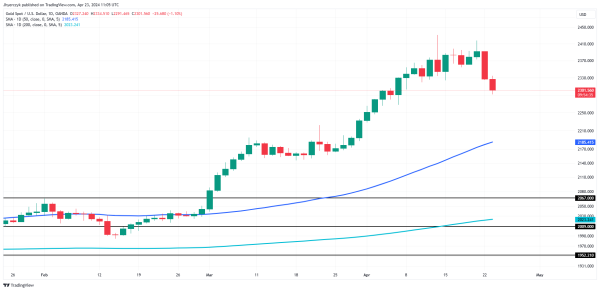
XAU/USD is down sharply for a second session on Tuesday as traders seek to complete a normal correction in a bull market.
The short-term range is $2146.155 to $2431.590. The first downside target is the 50% to 61.8% retracement zone at $2288.87 to $2255.19. Since the intermediate and long-term trends are up, buyers are expected to re-emerge on a test of this area.
The nearest major support is the uptrending 50-day moving average at $2185.416. This is followed closely by a swing bottom at $2146.155.
On the upside, it’s going to take a move through $2431.59 to signal a resumption of the uptrend. Short-term resistance, however, comes in at $2361.53.