Gold, Silver, EURUSD Technical Analysis As Markets React to Election and Fed Moves
The US dollar index (DXY) experienced heightened volatility following the US presidential election. The dollar index reached multi-month highs before easing due to profit-taking. Investors cautiously interpret Trump’s victory and the Federal Reserve’s 25 basis point rate cut. This move aligns with the central bank’s ongoing efforts to manage economic stability. Market attention is now on upcoming economic data, particularly the Michigan Consumer Sentiment Index, which could impact dollar strength.
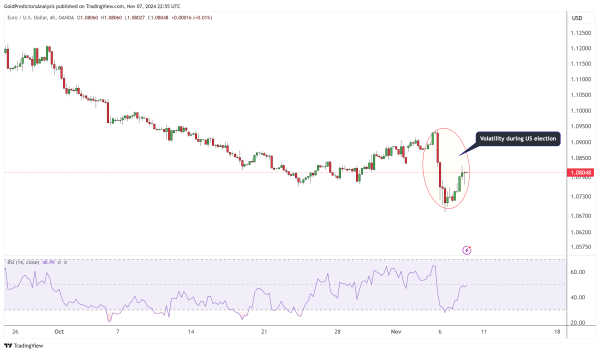
The EUR/USD pair recovered partially from Wednesday’s steep sell-off as it approached the 1.0800 level, though it remains under pressure. The European Central Bank (ECB) has also drawn market attention. Recent remarks from ECB officials indicate a cautious stance amid shifting global monetary policies. Despite a rebound, EUR/USD faces resistance and remains vulnerable to US dollar movements. The dollar’s recent strength and fluctuating expectations for further ECB policy shifts have left EUR/USD consolidated. This consolidation reflects investor caution in the current market landscape.
On the other hand, gold (XAU) and silver (XAG) found support and advances after Wednesday’s drop. Following the Fed’s rate cut, gold prices rallied, with the metal trading above $2,700. Investors turn to gold as a hedge against economic uncertainty and dollar fluctuations. The bullish momentum in gold reflects a safe-haven appeal, especially as the dollar’s strength shows signs of tapering. Gold’s upward trajectory could continue if inflation concerns and global economic risks persist, potentially driving more investors toward this traditional asset in market instability. The upcoming Michigan Consumer Sentiment Index data will further guide gold and silver.
Gold (XAU) Technical Analysis
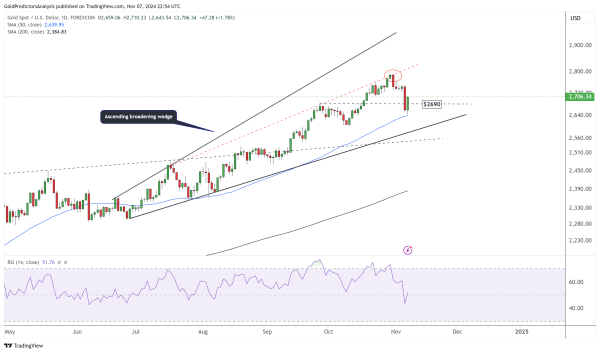
Gold Daily Chart – Bullish Hammer Ascending Broadening Wedge
The daily chart for gold shows that Trump’s victory led to a significant price drop, pushing the price below the strong support at $2,690 and reaching the 50 SMA around $2,650. The price then rebounded from the 50 SMA, exhibiting strong volatility.
This correction following Trump’s victory sets the stage for a potential rally in the gold market. Gold trades within an ascending broadening wedge and appears poised for an upward rally once the correction is complete. The Thursday candle points to a bullish hammer, which indicates a continuation of an upward trend.
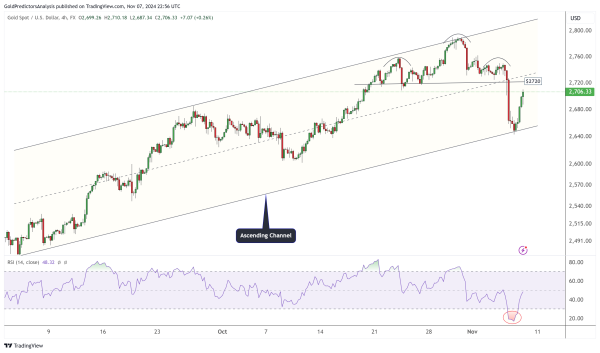
Gold 4-Hour Chart – Ascending Channel
The primary reason for the gold drop was the solid overbought condition, as the price was overextended on the daily and weekly charts. However, the 50-day SMA at $2,650 has provided support, forming another ascending channel on the 4-hour chart. The resistance for this rebound from $2,650 is $2,720, which aligns with the neckline of a head and shoulders pattern. Additionally, the RSI shows that the price is now rebounding from the oversold level on the 4-hour chart, indicating the potential for continued upward momentum.
Silver (XAG) Technical Analysis
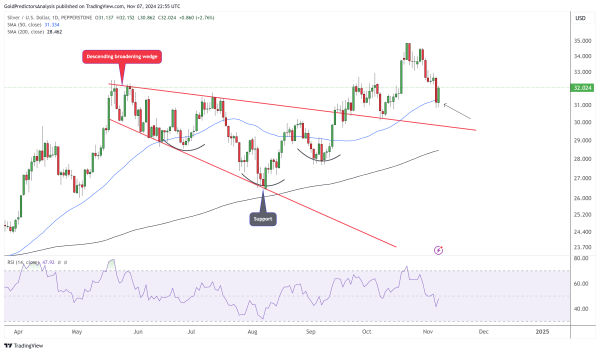
Silver Daily Chart – Rebounds from 50 SMA
The daily silver chart shows that the price correction is bringing the silver market back toward the level where the descending broadening wedge was broken. The price has reached the 50 SMA on the daily chart, forming strong support in the silver market. Overall, the silver trend remains upward, and this correction will likely provide a good buying opportunity at a better price.
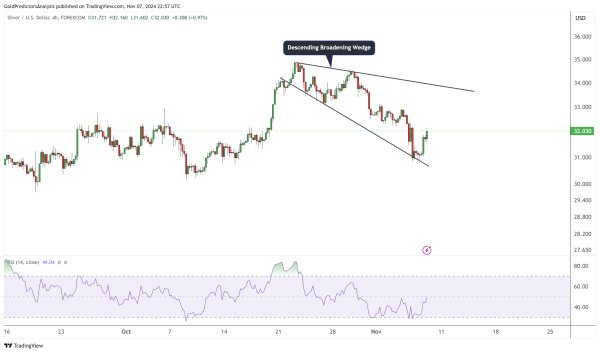
Silver 4-hour Chart – Descending Broadening Wedge
The 4-hour chart shows that the correction in silver prices has formed a descending broadening wedge, highlighting a bullish price pattern. The RSI is consolidating at a lower level, indicating that a buy signal may soon emerge. The resistance of this descending broadening wedge is at $33.90.
EURUSD Technical Analysis
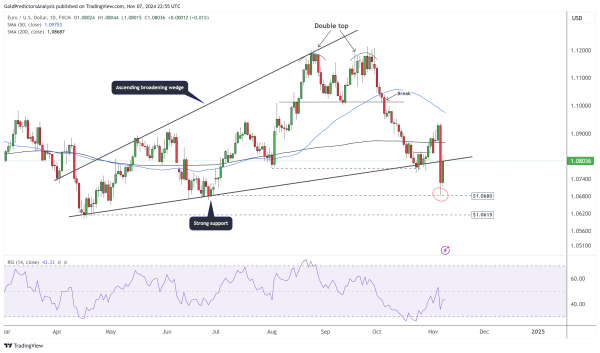
EURUSD Daily Chart – Rebounds from Support
The daily chart below shows the formation of an ascending broadening wedge, with the pair fluctuating near the breakout of this wedge amid election volatility. The pair dropped lower towards the strong support at $1.0680 and then reversed higher, closing above the wedge formation. This strong fluctuation emerged due to volatility in the US Dollar Index, which initially surged on Donald Trump’s victory but later reversed lower from resistance.
The pair trades below the 50 and 200 SMAs, indicating bearish pressure. However, it is likely to consolidate within a wide range.
EURUSD 4-Hour Chart – Volatility
The 4-hour chart also shows strong price volatility. The price does not show a definite direction and fluctuates within a wide range. Donald Trump’s victory initially pushed the pair downward, but it has since reversed higher. A break below $1.0680 could take the pair down to $1.0615.
