Gold (XAU) Daily Forecast: Market Awaits US CPI; Target $2400?
Market Overview
Gold prices saw a slight bounce off above $2,344 support area, closing of candles over this has pushed price to $2,355. The U.S. economic calendar highlighted a decline in the NFIB Small Business Optimism Index to 88.5, indicating a cautious business outlook.
Market focus now shifts to the forthcoming U.S. Consumer Price Index (CPI) and the Federal Open Market Committee (FOMC) Minutes release, set to provide critical economic insights.
Inflation Expectations and Federal Reserve’s Outlook
The March CPI is anticipated to show a 0.3% monthly increase, with the annual rate projected to rise to 3.4%.
Core CPI, excluding volatile items, is expected to slightly decrease, affecting the market’s rate cut forecasts.
Recent job market strength has cast doubts on imminent rate reductions, with the FedWatch Tool indicating a 57.8% probability of a June rate cut.
China’s Gold Acquisition Impact
Central to gold’s ascent is China’s aggressive acquisition strategy, with the People’s Bank of China notably expanding its reserves for 17 consecutive months, signaling a robust hedge against potential economic downturns and domestic market vulnerabilities.
This strategic gold buying, coupled with global economic uncertainties and persistent inflation concerns, shapes the precious metal’s valuation and market sentiment.
As investors eye U.S. CPI data for further rate direction, the precious metals market, particularly gold, remains a focal point of international financial dynamics, influenced significantly by central bank activities and geopolitical developments.
Gold Prices Forecast
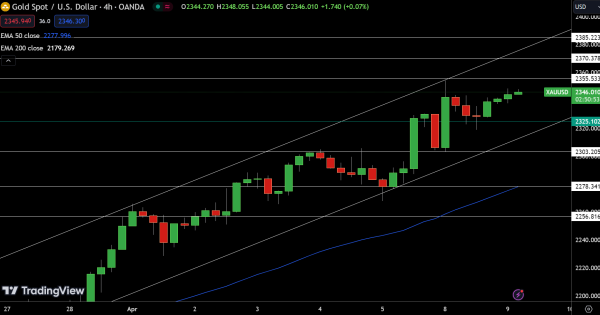
During the late Asian session, Gold (XAU/USD), trading at $2,358, shows a subtle increase of 0.22%, indicating a steady market sentiment. The pivot point at $2,344.52 serves as a critical juncture; surpassing it could propel gold towards resistance levels at $2,365.76, $2,385.22, and $2,401.45.
Conversely, falling below this pivot could lead to declines, with support established at $2,325.40, $2,303.21, and $2,278.34. The 50-day and 200-day Exponential Moving Averages at $2,294.25 and $2,189.41, respectively, underscore a bullish trend.
Gold’s current trajectory suggests potential for further gains, provided it remains above the pivotal $2,344.52 mark.