Gold (XAU) Daily Forecast: Prices Slide to $2,455; Double Top Signals a Drop?
Market Overview
Gold prices (XAU/USD) continued their downward trend for the second consecutive day on Wednesday, slipping to an intra-day low of $2,455.43.
This decline is largely driven by the stronger US dollar, which gained momentum despite soft U.S. producer inflation data, raising expectations for deeper interest rate cuts.
Positive sentiment in equity markets has further reduced demand for the safe-haven metal. Repositioning ahead of the critical US consumer inflation report due later today also influences the downturn.
However, concerns about escalating geopolitical tensions in the Middle East limit further downside for gold.
Gold Prices Fall Despite Fed Rate Cut Hopes and Cooling Inflation Data
Gold prices are declining despite growing expectations of deeper Federal Reserve rate cuts, driven by cooling inflation data. The US Producer Price Index (PPI) rose by 2.2% annually in July, down from 2.7% in June, while core PPI remained flat, signaling cooling inflation.
This trend suggests the Fed may soon begin cutting rates, leading to lower US Treasury bond yields and a weaker dollar.
Atlanta Fed President Raphael Bostic mentioned that he might support a rate cut by year-end if data confirms this trend.
The market’s focus is now on the US Consumer Price Index (CPI), which is expected to ease to 2.9% in July, with core CPI at 3.2%. If CPI data is weaker than expected, it could increase the likelihood of a 50-basis-point Fed rate cut in September, which would typically support gold prices.
However, despite these factors, gold prices are falling, possibly due to profit-taking, stronger economic data, or geopolitical concerns outweighing the supportive news.
Short-Term Forecast
Gold’s short-term outlook is bearish, below $2,476.44, with potential declines toward $2,443.98 and $2,422.12. A break above $2,476.44 could shift the momentum back to the bulls.
Gold Prices Forecast: Technical Analysis
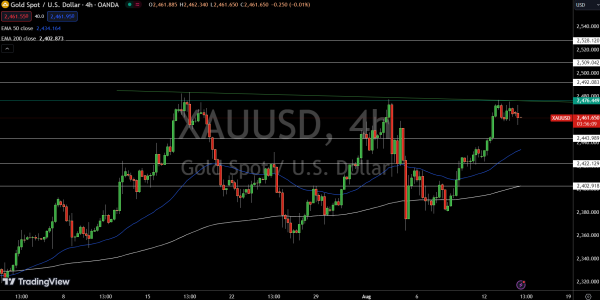
Gold (XAU/USD) is currently trading at $2,461.65, down 0.17% on the day. The key level to watch is the pivot point at $2,476.44, which is reinforcing the triple top pattern that’s been forming on the 4-hour chart.
This level is providing strong resistance, and if gold closes below it, we could see a bearish correction toward the immediate support at $2,443.98, with the potential to drop further to $2,422.12 or even $2,402.91.
On the upside, breaking above $2,476.44 would open the door to test the next resistance levels at $2,492.08, $2,509.04, and $2,528.12. The 50 EMA at $2,434.16 and 200 EMA at $2,402.87 suggest the current trend is bearish, but a move above the pivot point could shift momentum to the bulls.