Gold (XAU) Daily Forecast: Prices Surge as Iran-Israel Tensions Intensify; Time to Buy
Market Overview
Gold prices advanced in Monday’s Asian trading session amid increased safe-haven demand following Iran’s recent attack on Israel. The market’s focus remains on Israel’s potential response to Iran’s actions, which Tehran stated concluded its offensive.
This declaration, along with minimal damage reported, moderated the surge in safe-haven demand. The spot gold price rose to $2,372.90 per ounce. However, the strengthening U.S. dollar tempered the gains, capping the upward movement in gold prices.
Economic Factors Influencing Gold’s Outlook
The robust U.S. dollar and expectations of continued high U.S. interest rates are tempering gold’s gains, despite strong support from geopolitical tensions. Recent data revealed U.S. inflation spiked to 8.6% in May 2024, prompting the Federal Reserve to maintain higher interest rates to curb inflationary pressures. This scenario is critical for gold, traditionally an inflation hedge, as higher rates increase the opportunity cost of holding non-yielding assets like gold.
These movements reflect the dollar’s strength and mixed economic indicators from China, where slow economic growth is influencing global commodity prices.
As geopolitical issues in the Middle East unfold and global economic policies adapt, the outlook for gold remains closely tied to these developments. Investors are particularly keen on the U.S. Federal Reserve’s next moves, which are expected to be influenced by ongoing inflation challenges.
Gold Prices Forecast
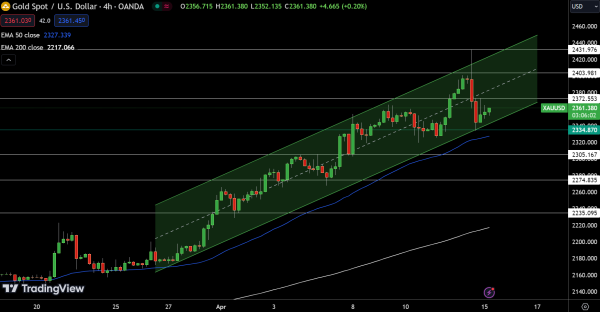
At the moment, Gold (XAU/USD) is trading at $2361.38, marking an increase of 0.74%. The metal’s technical posture suggests a bullish bias as it remains above the pivot point of $2334.87. Immediate resistance levels are at $2372.55, followed by $2403.98 and $2431.98. Should Gold advance past these barriers, further upward momentum is anticipated.
Support levels are set at $2305.17, with additional safety nets at $2274.84 and $2235.10. A breach below these could signify a reversal of the current upward trend. The 50-day Exponential Moving Average (EMA) at $2327.34 and the 200-day EMA at $2217.07 both underscore a sustained positive trend, providing technical support.
The formation of bullish candles above the $2335 area reinforces this optimism. As long as Gold maintains its position above this channel, the bullish outlook remains intact. However, a drop below $2334.87 could precipitate a sharp decline, alerting traders to a potential shift in market sentiment.