Gold (XAU) Daily Forecast: Struggles at $2,508, Will Bearish Trend Continue?
Market Overview
Gold (XAU/USD) remains under pressure around $2,508.27, with an intraday low of $2,499.44, driven by a strengthening US dollar after a four-day losing streak.
While global market optimism reduces gold’s safe-haven appeal, dovish Federal Reserve expectations may limit the dollar’s gains and help gold avoid deeper losses.
Delayed Israel-Hamas truce talks add geopolitical risks, potentially supporting gold prices. Traders are now focused on upcoming US economic data, including Weekly Jobless Claims and Existing Home Sales.
Gold Steadies Above $2,500 on Weak USD and Fed Rate Cut Speculation
Gold prices remain supported above $2,500, driven by a weakening US Dollar amid rising expectations of a Federal Reserve rate cut.
Although the USD has gained some momentum after a four-day losing streak, weaker-than-expected US job growth has fueled speculation that the Fed might reduce rates as early as September.
The July FOMC meeting minutes revealed broad support for a rate cut, pushing market expectations for a 50-basis-point reduction to 38%, up from 29% the day before.
Gold Rises Amid Israel-Hamas Conflict and Middle East Tensions
Ongoing conflict between Israel and Hamas continues to elevate gold prices as investors seek safety in the precious metal. Heightened tensions, including Israeli military advances in Deir el-Balah and a deadly attack on a Gaza school-turned-shelter, have fueled market caution.
Although U.S. President Joe Biden has urged Israeli Prime Minister Benjamin Netanyahu to agree to a temporary ceasefire, talks have stalled.
This unresolved conflict supports gold prices, reinforcing its appeal as a safe-haven asset amid geopolitical uncertainty.
Short-Term Forecast
Gold (XAU/USD) will likely face continued downward pressure around the $2,501 level. A potential break below the key support at $2,490 could trigger further declines, while resistance at $2,508 limits short-term gains.
Gold Prices Forecast: Technical Analysis
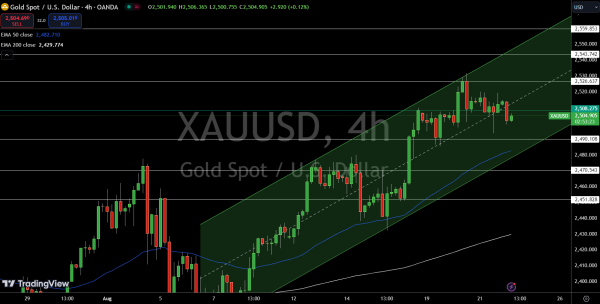
Gold is currently trading just below the pivot point at $2508.27, with immediate resistance levels at $2526.63, $2543.74, and $2559.85. The support lies at $2490.10, with further levels at $2470.54 and $2451.82.
The upward channel maintains a bullish bias; however, the price closing below the pivot point and near the psychological level of $2500 could indicate a potential downward correction.
The 50-day Exponential Moving Average (EMA) is positioned at $2482.71, while the 200-day EMA stands at $2429.77, both supporting the current trend.
Conclusion: Bearish below $2508.27; a break above this level may trigger more bullish momentum, and vice versa.