IAG's share price showing signs of life
After a mixed Q1, the share price of airline group IAG has begun to show some fresh strength
IAG's share price has displayed some recent strength after a tough start to the year. The airline group's stock had been lacklustre over the past 12 months, declining 6% even as the company returned to profitability amidst the travel industry's post-pandemic recovery.
Lingering pandemic effects
Recent full-year 2023 results showed IAG's total liabilities rising to €34.4 billion, up from €28.6 billion pre-Covid in 2019. This indicates the Spanish airline is still grappling with financial impacts from the measures taken to shore up its business during the pandemic's depths.
Promising operating performance
However, the 2023 results also gave shareholders reasons for optimism. IAG posted an operating profit above its 2019 pre-pandemic level for the first time. With booked capacity at a robust 92% for first quarter (Q1) and 62% for the first half of 2024, the outlook for operations appears bright.
Investing for future growth
While IAG is embarking on a new capital expenditure cycle, this investment should fuel earnings growth over the longer term. The company is already seeing more balanced revenue streams, such as its Spanish businesses delivering a €1.4 billion operating profit in 2023, up sharply from €0.6 billion the prior year.
Analysts recommendations
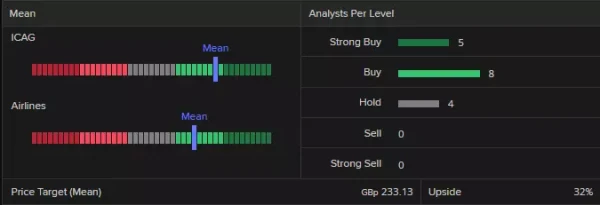
Fundamental analysts are rating IAG as a ‘buy’ with Refinitiv data showing 5 strong buy, 8 buy, 4 hold - with the mean of estimates suggesting a long-term price target of 233.13p pence for the share, roughly 32% above the share’s current price (as of 2 April 2024).
Technical analysis on the IAG share price
IAG’s share price has been oscillating around its 55-week simple moving average (SMA) between October and March before suddenly leaving its contracting sideways trading range and advancing for four consecutive weeks. It has broken out of its large triangle formation to the upside, hitting an over two-year high at 177.80p early on Tuesday morning.
IAG Weekly Chart
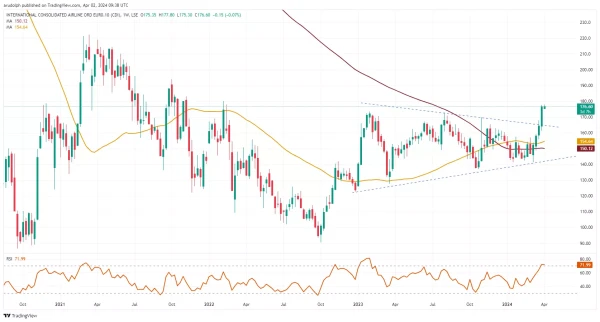
Next up is the February 2022 high at 180.10p, followed by the 193.90p October 2021 peak and the psychological 200p mark.
IAG Daily Chart
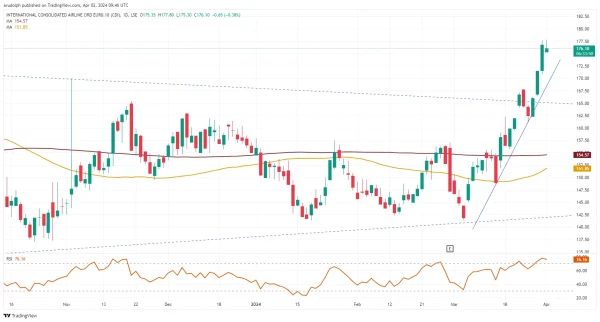
Immediate support can be spotted around the January 2023 high at 173.60p and then between the July and October 2023 highs at 172.95p to 170p highs.
While the late-March low at 161.20p underpins, the medium-term IAG uptrend is considered to be valid.