Indicator analysis: Daily review of EUR/USD on August 1, 2024
Trend Analysis (Fig. 1)
Today, EUR/USD may continue to fall from 1.0824 (the close of yesterday's daily candle) with a target of 1.0807 – the 50% pullback level (red dashed line). Upon reaching this level, the price may start rising with a target of 1.0845 – the record resistance level (blue dashed line).
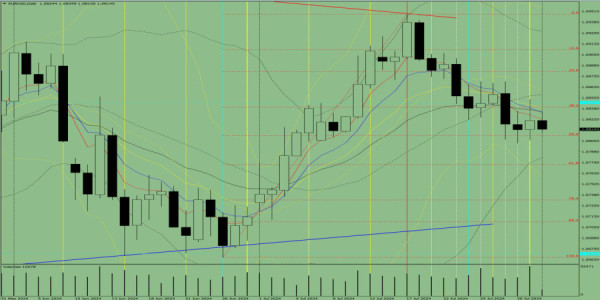
Fig. 1 (daily chart)
Comprehensive analysis:
- Indicator analysis – Down
- Fibonacci levels – Down
- Volumes – Down
- Candlestick analysis – Down
- Trend analysis – Down
- Bollinger Bands – Down
- Weekly chart – Down
General Conclusion:
Today, EUR/USD may continue to fall from 1.0824 (the close of yesterday's daily candle) with a target of 1.0807 – the 50% pullback level (red dashed line). Upon reaching this level, the price may start rising with a target of 1.0845 – the record resistance level (blue dashed line).
Alternative scenario: On Thursday, the pair may continue to fall from 1.0824 (the close of yesterday's daily candle) with a target of 1.0798 – the lower fractal (daily candle from July 30, 2024). Upon reaching this level, the price may start rising with a target of 1.0845 – the record resistance level (blue dashed line).