Indicator analysis of EUR/USD on September 23, 2024
Trend-following analysis (figure 1)
On Monday, the market may start moving down from the level of 1.1162 (Friday's daily candle close), targeting 1.1138, which is the 14.6% retracement level (yellow dashed line). From this level, the price could begin to move up towards 1.1181, which is the upper fractal (daily candle from September 20, 2024).
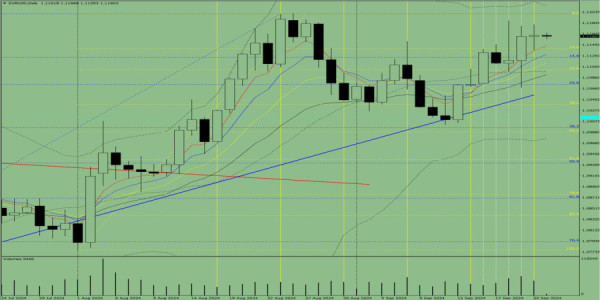
Figure 1 (daily chart)
Complex analysis
Indicator analysis – down
Fibonacci levels – down
Volume – down
Candlestick analysis – down
Trend-following analysis – down
Bollinger bands – down
Weekly chart – down
Conclusion
Today, from the level of 1.1162 (Friday's daily candle close), the price may start moving down towards 1.1138 – the 14.6% retracement level (yellow dashed line). From this level, the price could begin moving up to 1.1181 – the upper fractal (daily candle from September 20, 2024).
Alternative scenario. From the level of 1.1162 (Friday's daily candle close), EUR/USD may start moving down towards 1.1138 – the 14.6% retracement level (yellow dashed line). From this level, the price may continue moving down towards 1.1122 – the 14.6% retracement level (blue dashed line).