Marathon Digital under pressure despite strong results
U.S.-based Bitcoin mining behemoth Marathon Digital has published its quarterly earnings report and has beaten analyst predictions by a good margin. Paradoxically, Marathon's stock price dipped shortly after the announcement. This is, however, likely a temporary blip.
Marathon beats expectations
Although Marathon Digital was not necessarily in trouble last year, the crypto winter put a bit of a damper on its plans, as did the SEC, who targeted the firm among a slew of other companies. However, Marathon Digital has since recovered. Earlier this year, it reported that its Bitcoin production rate had tripled when compared to 2022. Since then, the company's results have only gotten better.
Marathon Digital reported total earnings before interest, taxes, depreciation and amortisation (EBITDA) for 2023 of $419.9 million. To put this into perspective, it suffered a loss of $543.4 million in 2022.
On the technical side of things, Marathon Digital increased its Bitcoin production rate by 210% and reached an energised hash rate of 24.7 EH/s, up 253% compared to 2024.
Marathon Digital's production capacity increase was partly due to its mining fleet efficiency improving by 21%, going from 30.9 J/TH (joules per terrahash) to 24.5. Once all technical indicators were accounted for, the company's mining fleet produced a total of 12,852 Bitcoin.
Future plans
Although the firm had strong results over the past year, CEO Fred Thiel expects further strength.
In 2023, Marathon Digital also entered into an agreement to acquire two more data centres. Once integrated into its fleet, the company will be actively mining with a 900-megawatt capacity, with over 45% of miners on its property.
Marathon Digital stock price – technical analysis
The Marathon Digital Holdings share price in late-February rallied to a $34.09 2 ¼ year high, to levels last traded in January 2022, but is now traded down around 1% year-to-date.
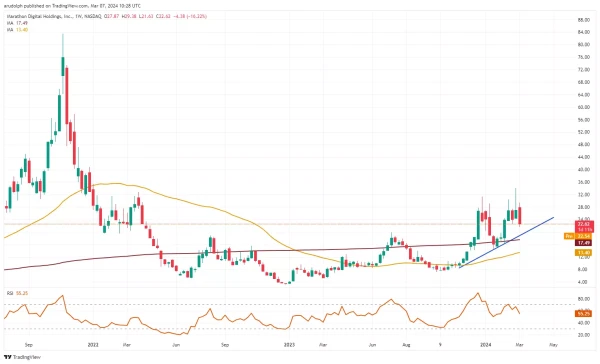
The weekly chart shows that the Marathon Digital Holdings share price’s spike to its February high was followed by a swift reversal to the downside.
Marathon Digital Holdings weekly candlestick chart


If a weekly chart close below last week’s low at $24.41 were to be made on Friday, a bearish engulfing candle would be formed on the weekly candlestick chart. It would confirm a medium-term trend reversal, especially since the February peak was accompanied by negative divergence on the weekly relative strength index (RSI), and probably lead to the previous major $19.51 to $18.88 resistance area, now because of inverse polarity a support zone, being revisited. It consists of the January and February 2022 lows and the August 2022 and July 2023 highs with the November-to-March uptrend line going through this support zone as well.
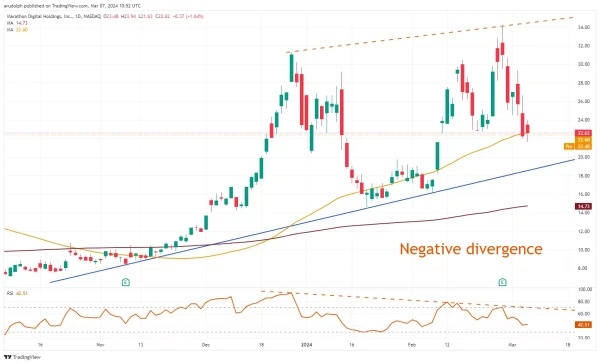
Marathon Digital Holdings daily candlestick chart


On the daily chart the Marathon Digital Holdings share price is trying to stem its sharp recent decline around the 55-day simple moving average (SMA) but given the current speed and rate of descent from a momentum point of view, further downside pressure is likely to be encountered, provide that no rise and daily chart close above the 4 March high at $29.38 is seen. Even if this were to be the case, the late February peak at $34.09 may not be revisited anytime soon.
Were the major $19.51 to $18.88 support zone to be reached instead and not hold as expected, the January low and 200-day SMA at $14.62 to $14.73 may do so.