March market performance: everybody contributed to the party
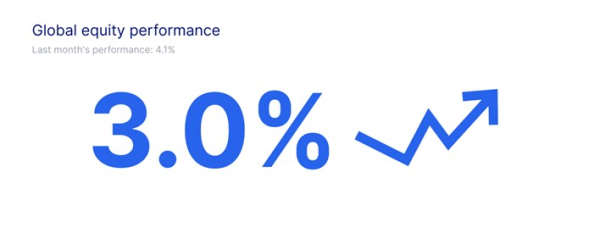
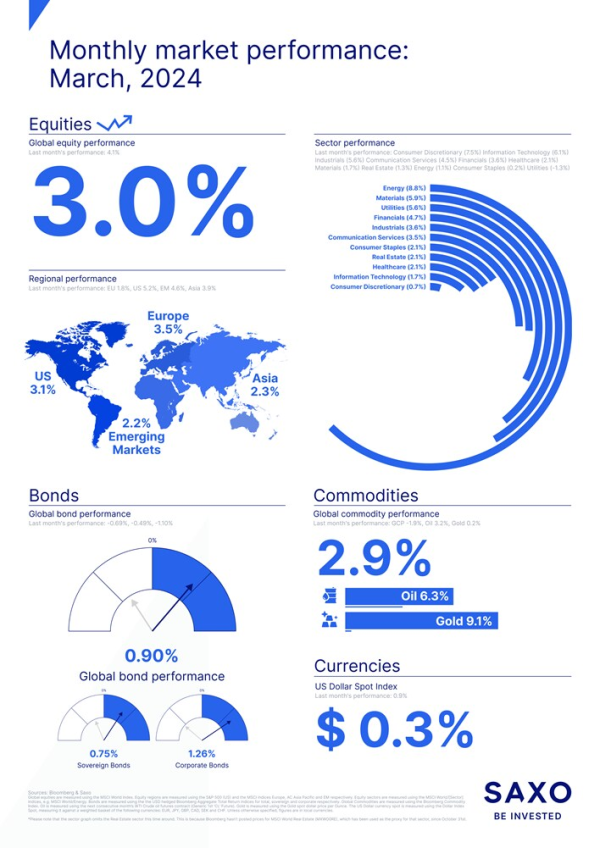
As we conclude the first quarter of 2024, the financial performance fired on all cylinders in March. Global equities rose by 3% in a month where all regions posted positive results.
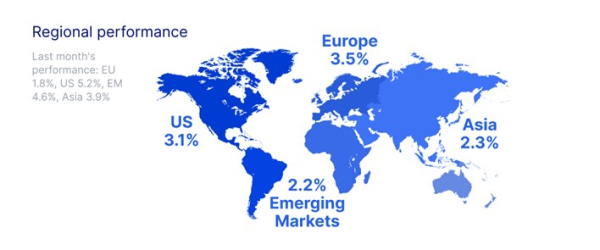
The best performing region in March was Europe, climbing 3.5%, as inflation figures as well as the overall macroeconomic picture showed a situation, where easing financial conditions in the shape of rate cuts seem increasingly likely compared to rate hikes and where recession scares are lower even though there are still risks on the horizon.
In the US, rate cuts continue to be postponed due to an economy that still seems to be in a relatively good condition according to the stock markets, despite continued uncertainties due to e.g. stretched valuations, the upcoming election, and growing debt. As such, the S&P 500 posted a return of a bit more than 3%.
The Asian and Emerging Markets regions posted returns of 2.2% and 2.3% respectively. The performance was driven by a rebound in Chinese equities fuelled by, among other things, some positive earnings although the latter part of the month saw some less positive reports from companies like Alibaba.
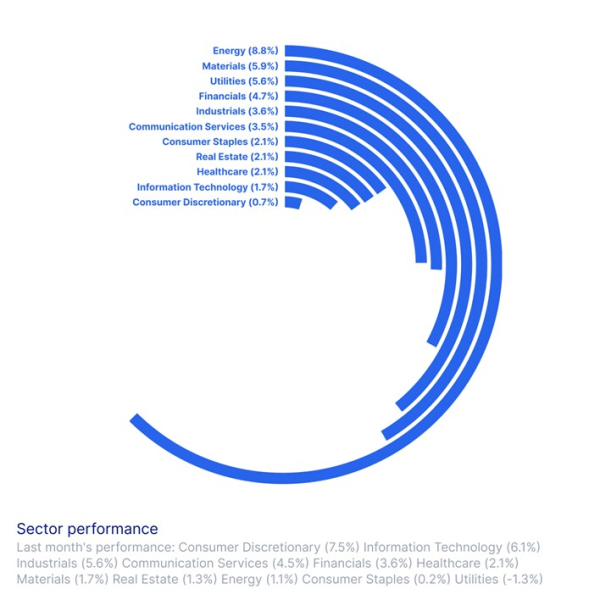
Energy was the best performing sector in March as oil prices had a good month, which is also clear from the commodities graph in the infographic further down.
While all sectors posted positive returns for March, the so-called Magnificent Seven stocks have started to show some cracks, with two of the three sectors they belong to – information technology and consumer discretionary – posting the lowest returns.
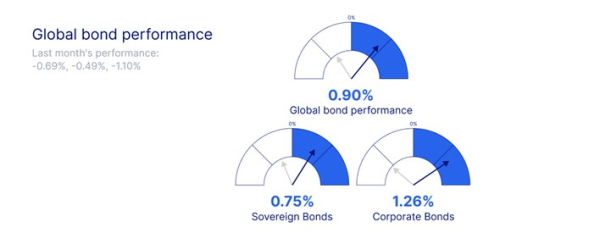
Bond performance was also positive throughout March, although we saw a notable trend: risky assets outpaced quality investments as the economy stays resilient in the US, and it shows signs of recovering in Europe. However, concerns persist as inflation appears to be stabilising at a level notably higher than the 2% target set by central banks. This persistent inflationary pressure dampens prospects for a bond bull market, as investors seek greater returns to hold fixed-income securities. Considering these factors, we exercise caution and advocate for short-term bonds over their longer-duration counterparts. Bond performance is written with support from Althea Spinozzi, Head of Fixed Income Strategy at Saxo.
Sources: Bloomberg and Saxo
Global equities are measured using the MSCI World Index. Equity regions are measured using the S&P 500 (US) and the MSCI indices Europe, AC Asia Pacific, and EM respectively. Equity sectors are measured using the MSCI World/Sector] indices, e.g., MSCI World/Energy. Bonds are measured using the USD hedged Bloomberg Aggregate Total Return indices for total, sovereign, and corporate respectively. Global Commodities are measured using the Bloomberg Commodity Index. Oil is measured using the next consecutive month’s WTI Crude oil futures contract (Generic 1st CL Future). Gold is measured using the gold spot dollar price per ounce. The US Dollar currency spot is measured using the Dollar Index Spot, measuring it against a weighted basket of the following currencies: EUR, JPY, GBP, CAD, SEK, and CHF. Unless otherwise specified, figures are in local currencies.