Markets to watch this week
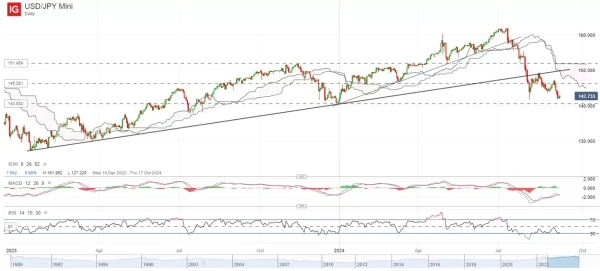
USD/JPY: Room to stabilise near-term but too early to call for a reversal
Following a break below a key upward trendline back in August and a subsequent rejection (16 August), the USD/JPY is back to trade around its August 2024 low at the 141.68 level. There may be room for the pair to stabilise in the near term, as US-Japan 10-year bond yield differential are back at a crucial level (3.85% in line with April 2023 and August 2024 low).
The Commodity Futures Trading Commission (CFTC) data also shows that yen speculative net positions are now in net-positive territory for the first time since March 2021, which suggests that the bulk of the yen carry-trade unwinding may be behind us. Potential room for bearish risk sentiments to stabilise into the new week may also limit some safe-haven flows for the yen.
That said, any short-term recovery may potentially face a test of resistance at the 146.26 level. Its daily relative strength index (RSI) may also have to see a move back above its mid-line, in order to offer more conviction of buyers taking control. Thus far, the policy divergence narrative between the US Federal Reserve (Fed) and the Bank of Japan (BoJ) is likely to persist, with further rate hike currently priced for the BoJ by early next year.
Levels:
R2: 103.40
R1: 146.26
S1: 140.53
S2: 99.12
USD/JPY Index chart:
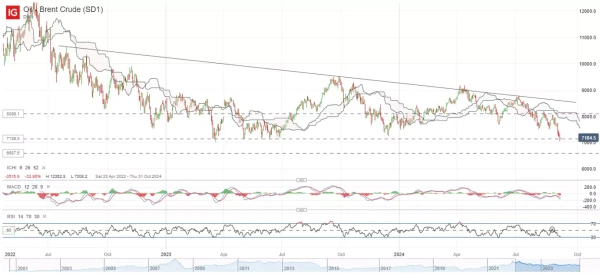
Brent Crude: Back to retest crucial horizontal support
Brent Crude prices are back to trade at its 2023 lows around the US$71.84 level, as China’s economic headwinds, alongside softer economic conditions in US and the Eurozone, cast doubts over the oil demand outlook. While this is pitted against Libya’s oil flows disruption, ongoing tensions in the Middle East and a potential delay in OPEC+’s easing of production cuts, some views are that these factors may be temporary and impact on prices may be short-lived.
While buyers may attempt to defend the crucial support for now, it is too early to call for a broader reversal. Its daily RSI has struggled to cross back above its mid-line on previous two retests thus far, while prices trade on a series of lower highs since September 2023. The latest CFTC data showed money managers cutting their net long US crude futures and options positions to the lowest since February this year.
Any breakdown of the US$71.40 level could potentially pave the way towards the US$65.87 level next (Aug and Dec 2021 low). On the upside, resistance could be presented at the US$75.22 level.
Levels:
R2: 80.86
R1: 75.22
S1: 71.40
S2: 65.87
Brent Crude chart:
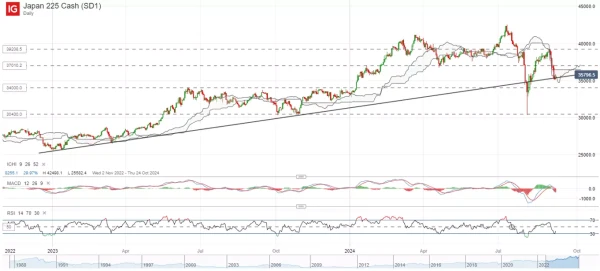
Japan 225 index: Back at trendline support
Following a more than 10% sell-off since the start of the month, the Japan 225 index is now back at an upward trendline support around the 35,200 level (the aggressive 5 Aug dip below the trendline seems like a false break to shake out weak hands). There may be room for risk sentiments to stabilise into the new week, with the balance of risks clearly shifted from inflation to growth and several key US growth data (Purchasing Managers’ Indexes (PMIs), jobs report) are behind us for now. Eyes will still be on the US consumer price index (CPI) this week, but barring any significant surprises, market reaction to inflation read may be more limited.
Nevertheless, any rebound in the Japan 225 index may have to face a test of resistance at the 37,000 level, followed by the 37,700 level where its key 200-day moving average (MA) stands. We may still expect a tone of caution in the lead-up to the upcoming Federal Open Market Committee (FOMC) meeting and with weak seasonality underway, therefore any dip-buying should potentially be on a short-term basis.
Levels:
R2: 39,200
R1: 37,000
S1: 35,200
S2: 34,000
Japan 225 chart: