Markets to watch this week
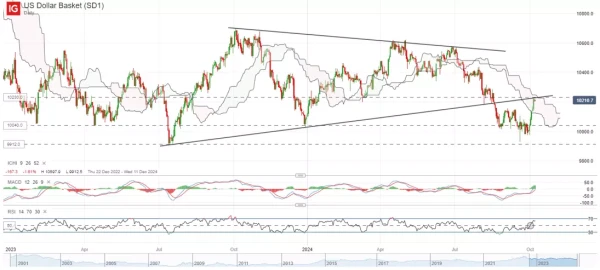
US Dollar Index: Signs of revival as less-dovish rate pricing found validation
The degree of outperformance in the recent US non-farm payrolls seems to make the 50 basis point (bp) cut in September look like an overreaction from the Federal Reserve (Fed) and called for less urgency in future policy easing. Rate expectations have now moved to price out a 50 bp move from the Fed through the rest of the year, and with the next job report still a month out, market participants may continue to bask in hopes of a soft landing and a more gradual pace of rate-cutting process, which may offer more runway for US dollar strength.
On the technical front, the US dollar is back to retest a key resistance confluence around the 102.30 level. Therefore, we may prefer taking up longs on any retracement towards the 101.42 level instead. Its daily relative strength index (RSI) has managed to edge above its key 50 level for the first time since July 2024, which suggests a near-term switch in trend to the upside. Any move above the 102.50 level could leave the next target at the 103.61 level.
Levels:
R2: 103.61
R1: 102.30
S1: 101.42
S2: 100.40
US Dollar Index chart:
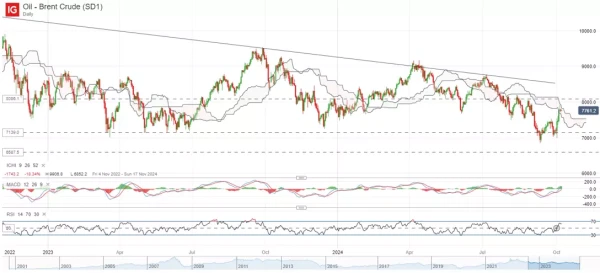
Brent crude: Is the worst over for oil prices?
Sentiments around oil prices remain locked in a wait-and-see for Israel’s response to Iran, with eyes on whether Iran’s energy infrastructure will be impacted and if the tit-for-tat on both sides will broaden into a regional conflict. While further clarity awaits, oil prices seem to have reverted to a near-term bullish trend on the technical front. Its daily RSI has headed above its mid-line for the first time since July 2024, while its daily moving average convergence/divergence (MACD) also eyes for a crossover into positive territory as a sign of mounting upward momentum.
Any contained retaliation from Israel could see oil prices unwind some of its near-term gains, but a more optimistic demand outlook from US and China may likely offer some support to its upward trend. We may expect prices to retest the US$80.86 level ahead, followed by the US$85.25 level, where a longer-term term downward trendline may stand as resistance.
Levels:
R2: 85.25
R1: 80.86
S1: 75.22
S2: 71.40
Brent crude chart:
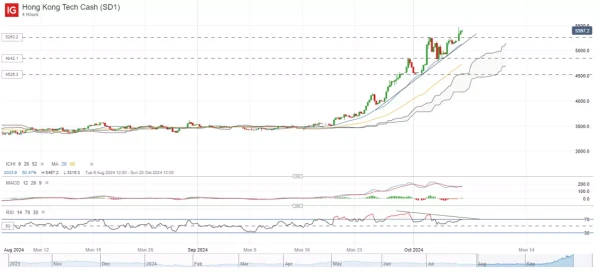
Hang Seng Tech Index: Upward bias intact but buy-on-dips preferred
An onslaught of easing measures from China has taken Chinese equities to their highest level since February 2022, driven by a combination of short-covering activities, a valuation reset and aggressive catch-up buying from hedge funds and institutions. On the four-hour chart, the Hang Seng Tech Index has been guided nicely by a support confluence, consisting of an upward trendline and its 20-period moving average (MA), which may keep the near-term upward trend intact.
That said, we will suggest buying on dips on the basis that recent higher highs could present a bearish divergence on its RSI and MACD. A return in its RSI back towards its mid-point may present a more attractive point of entry for new longs, while current long positions may continue riding the trend until the trendline support confluence is broken down.
Levels:
R2: 6,000
R1: 5,714
S1: 5,263
S2: 4,842
Hong Kong Tech chart: