Metals lead, No improvement in Canada’s manufacturing sector, ISM: The US manufacturing activity expands, Crude oil price rally, Bitcoin retreats heavily
Previous Trading Day’s Events (01.04.2024)
While the manufacturing rebound is a boost for the economy’s growth prospects, the rise in raw material prices suggested goods inflation could pick up in the months ahead. Goods deflation was the key driver of an inflation slowdown last year.
“If the contraction of manufacturing activity is over, far too soon to say, and price pressures are building in manufacturing, which appears to have been happening for the last three months, then this would have implications for the path for interest rates in 2024,” said Conrad DeQuadros, senior economic advisor at Brean Capital in New York.
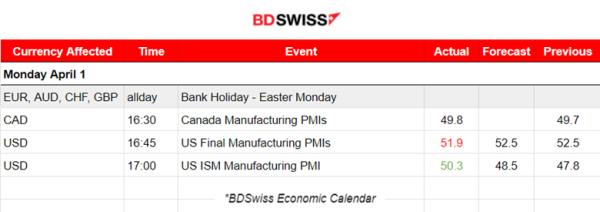
The ISM said its manufacturing PMI increased to 50.3 last month, the highest and first reading above 50 since September 2022, from 47.8 in February.
Source: https://www.reuters.com/markets/us/us-manufacturing-sector-grows-first-time-1-12-years-2024-04-01/
______________________________________________________________________
Winners vs Losers
Metals are on the top of the winner’s list for the week. Silver leads with 2.42% gains so far, followed by Gold having 1.09% gains.

______________________________________________________________________
News Reports Monitor – Previous Trading Day (01.04.2024)
Server Time / Timezone EEST (UTC+03:00)
- Midnight – Night Session (Asian)
No important announcements, no special scheduled figures to be released.
- Morning – Day Session (European and N. American Session)
At 16:30, according to Canada’s manufacturing PMI report, the economy remained subdued in March. Output and new orders both continued to fall. Reports of supply chain delays led to a firmer increase in input prices. However, confidence in the 12-month outlook improved. The PMI figure remained below the crucial 50.0 no-change mark in March for an eleventh successive month signaling another worsening.
At 16:45 the U.S. Final Manufacturing PMI figure was reported above 50 but worse than the previous figure. Is still in expansion though. The ISM manufacturing index has unexpectedly risen above the break-even 50 level. The March index exceeded all estimates in a Bloomberg survey of economists. The dollar started to gain more strength intraday after these releases, as per the dollar index chart below.
General Verdict:

__________________________________________________________________
FOREX MARKETS MONITOR
EURUSD (01.04.2024) 15m Chart Summary
Server Time / Timezone EEST (UTC+03:00)
Price Movement
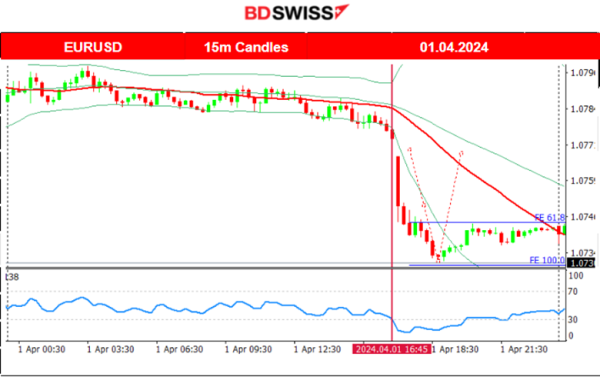
The pair was moving with low volatility and around the 30-period MA before the U.S. news. The Easter Monday holiday with banks closed kept activity low. That changed with the PMI releases after 16:30. The dollar appreciated against the EUR and other currencies quite significantly as the factory economy seems to expand in the U.S. This caused the drop of the pair to the support at near 1.0730 before retracement took place back to the MA.
___________________________________________________________________
CRYPTO MARKETS MONITOR
BTCUSD (Bitcoin) Chart Summary 1H
Server Time / Timezone EEST (UTC+02:00)
Price Movement
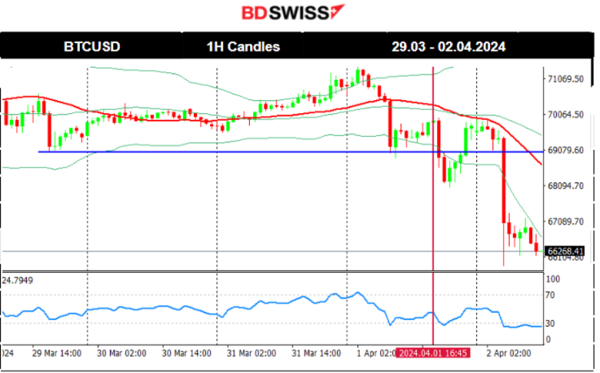
Since the 22nd of March, Bitcoin experienced a good comeback with the price moving upwards crossing the 30-period MA on its way up and showing upward momentum since the fall from the 74K USD peak. The 68K USD level resistance was breached on the 25th of March and the price moved higher even beyond 70K USD. The 30-period MA turned sideways as the price slowed down.
Last week a steady upward movement took place forming a wedge until the 31st of March. On the 1st of April, the price broke the wedge to the downside and dropped heavily back to support near 69K USD. That support was broken twice as Bitcoin eventually on the 2nd of April saw heavy drops. Around the same time as the drawdown, Bitcoin exchange-traded funds (ETFs) posted a net outflow of $86 million, breaking a four-day positive inflow streak, per FarSide data.
Source: https://cointelegraph.com/news/bitcoin-price-flash-crash-leverage-positions-liquidated
Crypto sorted by Highest Market Cap:
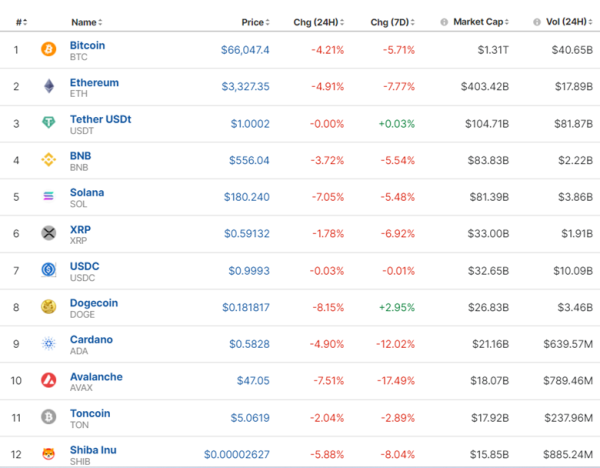
Finally some movement, however is not the desired one for Crypto traders. The market currently is suffering and Bitcoin ETF positive net outflows numbers take place once more this week. All prices retreat and once more we see the positive and strong correlation between all crypto assets as they all experience losses simultaneously.
Source: https://www.investing.com/crypto/currencies
______________________________________________________________________
EQUITY MARKETS MONITOR
S&P500 (SPX500) 4-Day Chart Summary
Server Time / Timezone EEST (UTC+03:00)
Price Movement
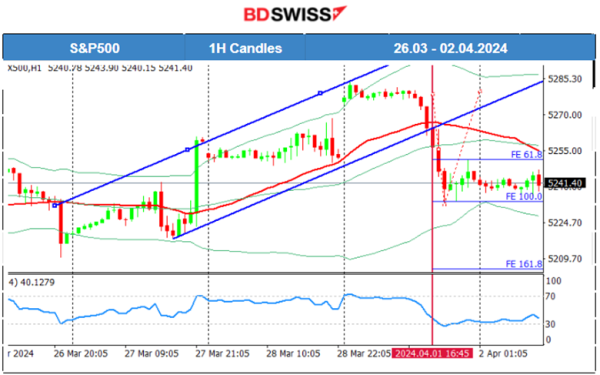
S&P500 jumped to near 5,270 USD on the 27th of March. This move broke the channel and it crossed the 30-period MA on its way up. The market was closed on the 29th of March. On the 1st April, the market opened with a gap upwards. Correction followed with a heavy drop until the support near 5,234 USD. Retracement followed with the price approaching and staying close to the 30-period MA. Currently, there are no apparent signals on where the market is headed. However, the RSI is showing higher lows.
______________________________________________________________________
COMMODITIES MARKETS MONITOR
USOIL (WTI) 4-Day Chart Summary
Server Time / Timezone EEST (UTC+02:00)
Price Movement
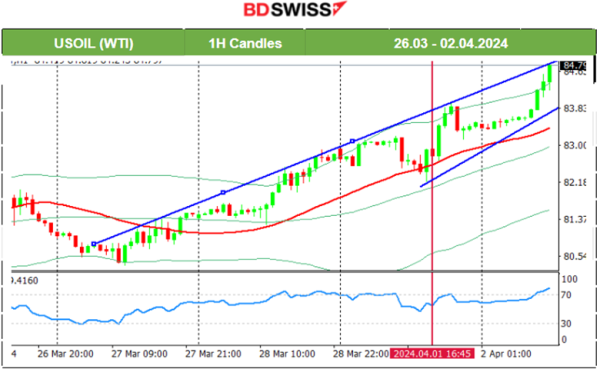
On the 27th of March, the price reversed, crossing the 30-period MA on its way up and settled currently near 81.50 USD/b. On the 28th of March, we have a wedge breakout to the upside that leads the price back to 83 USD/b. The 82 USD/b was an important resistance and upon breakout, it led to the price jump. The market closed on the 29th of March. On the 1st of April, after the news regarding the expansion of the U.S. manufacturing sector Crude oil actually jumped higher and remained on the upside. Today it’s aggressively moving on this uptrend confirming an upside strong momentum.
The latest news shows that production cuts indeed take place. Reuters Survey Shows OPEC Output Reduced in March:
https://oilprice.com/Latest-Energy-News/World-News/Reuters-Survey-Shows-OPEC-Output-Reduced-in-March.html
XAUUSD (Gold) 4-Day Chart Summary
Server Time / Timezone EEST (UTC+03:00)
Price Movement
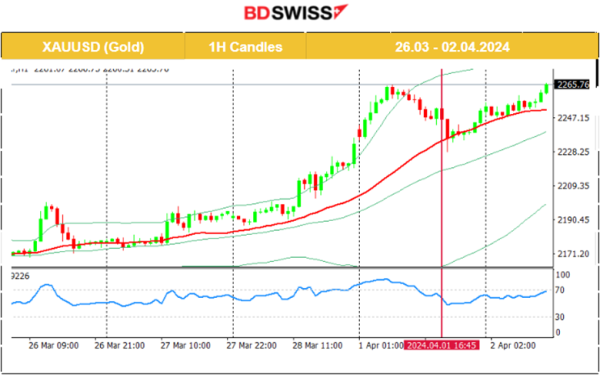
On the 27th of March Gold saw a rise again and tested the resistance at 2,200 USD/oz again. As mentioned in our previous analysis, Gold continued with the upside on the 28th of March. It experienced a great upward movement as it broke that resistance. The 2,200 USD/oz level was quite important and part of a triangle formation. Its resistance breakout led to a jump over 2,230 USD/oz. The market closed on the 29th of March. On the 1st of April the price lowered and despite the manufacturing PMI favourable for the USD release that caused the price to drop heavily, Gold could not remain on the downside. An uptrend formed and continues to be resilient.
______________________________________________________________
News Reports Monitor – Today Trading Day (02 April 2024)
Server Time / Timezone EEST (UTC+03:00)
- Midnight – Night Session (Asian)
No important announcements, no special scheduled figures to be released.
- Morning – Day Session (European and N. American Session)
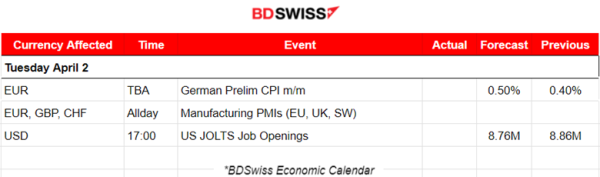
The Inflation-related figure for Germany could have an effect on the EUR but the EURUSD pair is mostly driven by USD effects. Any significant movement could take place from the PMIs as well.
The JOLTS report on job openings could shake the market. However, we do not expect an intraday shock. Volatility though should be higher than normal during the release. Job openings were at some point growing for the last few releases and currently are stable.
General Verdict:
______________________________________________________________