Moneycontrol Pro Market Outlook: Amid Middle East tensions, signs of a potential rebound
Dear Reader,
The global financial markets experienced significant turbulence following the weekend's aerial assault launched by Iran against Israel. Concerns over the potential escalation into a full-scale conflict in the Middle East triggered a wave of panic selling across global equity markets. Concurrently, apprehensions regarding disruptions to global oil supplies emanating from the world's largest oil-producing region led to a notable uptick in oil prices. Investors sought refuge in gold, driving its value to a historic peak amid heightened uncertainty.
Friday started on a weak note amid rumours of an attack on a nuclear facility in Iran, which initially dampened market sentiment. However, subsequent denial of such events by the Iranian government facilitated a sharp rebound in market confidence. Nevertheless, Indian equity markets concluded the week in negative territory, reflecting prevailing apprehensions and broader market volatility.
High probability of a dead cat bounce
After four consecutive weeks of gains, the Nifty index concluded the week on a downtrend. Despite this decline, it managed to maintain its position above the 20-week average mark of 21,921. Notably, the weekly momentum indicators continue to display a bearish trend with a downward trajectory.
This prompts us to remain open to the possibility of a further decline below the 21,921 level, potentially reaching as low as 21,100 in the coming weeks. However, with the commencement of a new week, the likelihood of an initial rebound remains.
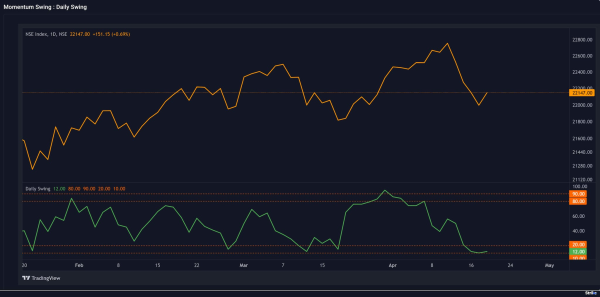
During the week, the momentum swing indicator, as illustrated in the Daily Swing chart, reached an extreme oversold condition, nearing 5 percent at one point. It hit a low of 10 near the lower red line on Thursday before rebounding on Friday. Currently, the swing indicator stands at 12, with the potential to rise further toward the 30-50 range before experiencing another downturn. The previous high point of 22,326 or the gap zone around 22,427 could serve as potential retracement levels.
Both swing indicators are positioned in oversold territory, with the Average Swing indicator reading at 15, while the Daily Swing indicator sits at 12, suggesting a likelihood of a bounce.
Daily Swing (Chart 1)
Source: web.strike.money
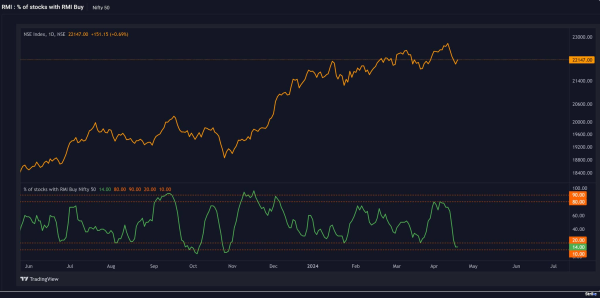
The percentage of stocks giving buy signals (see chart Buy Signals) in the Nifty 50 also dropped to 14--an oversold reading in the near term. Once again, the implication is a near-term bounce in markets to relieve the oversold reading.
Buy Signals (Chart 2)
Source: web.strike.money
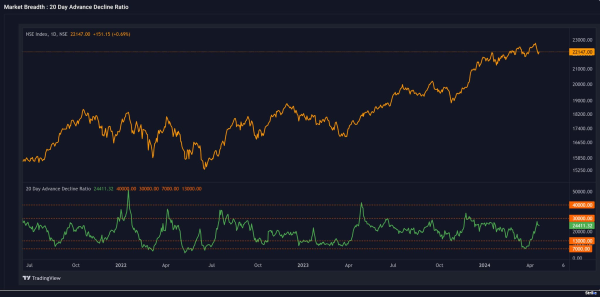
A slightly more medium-term indicator (see chart Advance Decline ratio)is the 20-day advance-decline ratio, which was oversold at the March 2024 bottom and has bounced out of that condition. Today, it is neither extremely oversold nor overbought, so the medium-term trend remains open to extending either way.
Advance Decline ratio (Chart 3)
Source: web.strike.money
Indices and Market Breadth
A volatile week ended with the broader indices underperforming the benchmark index. The Nifty50 closed the week with a loss of 1.65 percent, the Sensex was down 1.55 percent, and the midcap index fell by 2.2 percent.
The market fall impacted all sectors, as none of them could close in positive territory. Among the sectoral indices, IT sectors lost 4.7 percent, followed by a 3.7 percent fall in PSU Banks, a 2.7 percent drop in real estate stocks, and a 2 percent drop in pharmaceutical shares.
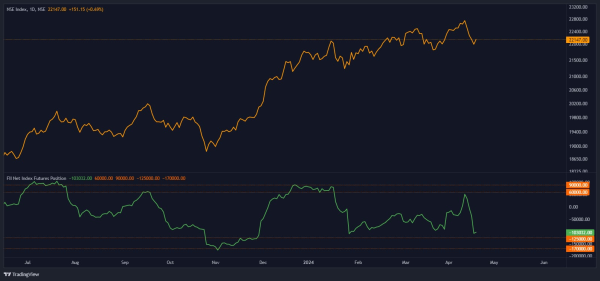
Foreign institutional investors (FIIs) were active during the volatile week, selling shares worth Rs 11,867.03 crore in the cash market. However, the real action was in the derivative markets, where they covered their long position of 33,488 contracts and are now short 103,032 contracts (see chart FII derivative position).
The sharp rise on Friday has not affected their short position in the market. FIIs' short position is closer to the oversold levels, but it still has some room for addition.
FII derivative position (Chart 4)
Source: web.strike.money
Among the top gainers during the week were Moschip Technologies rising 35.46 percent, Solara Active gained 33.70 percent while Dhani Services gained 27.32 percent.
The top losers were Sun Pharma Advanced Research Company, falling 18.53 percent, TruCap Finance lost 10.19 percent and Gensol Engineering shed 9.63 percent.
Global Market
While global markets fell on fears of war, Nasdaq had to bear the brunt of poor earnings from some of the top companies. Nasdaq fell for six straight days, its longest streak in more than a year, due to a sharp drop in Nvidia and Netflix.
Nasdaq ended the week 5.52 percent lower, while S&P500 was down 3.05 percent. The Dow Jones index, however, was flat and closed 0.01 percent higher. MSCI World Index fell by 2.85 percent.
The European markets were also in red, with the Euro Stoxx50 falling 0.76 per cent while German and British markets came down by over 1 per cent each. DAC closed the week flat with a 0.14 percent gain.
The biggest fall of the week was in the Japanese market, which gained 6.16 percent, followed by Taiwan, which fell 5.83 percent, and Hong Kong, which was down 2.98 percent. On the other hand, Chinese markets closed 1.5 percent higher on better than expected GDP numbers.
Stocks to watch
Among the stocks that are expected to perform better during the week are HAL, Jindal Steel, M&M, Hindalco, BEL, Trent, Sundaram Finance, Maruti and Grasim.
Among the weaker stocks are IdeaForge, Tata Tech, HUL, Atul, Dabur, CCL, Jubilant Food, Zee and Manyavar.
Cheers,
Shishir Asthana