Moneycontrol Pro Market Outlook | High probability of markets touching new highs during the week
Dear Reader,
Despite comprising only three trading days, the final week of fiscal year FY24 concluded with a robust market performance, as benchmark indices rose by nearly one percent. Particularly noteworthy were the last two days of the March expiry, during which both the Nifty and Sensex closed in on their previous highs. This surge was fuelled by end-of-year fund buying observed across various sectors, leading to a broad-based rally.
In the March series, the Nifty experienced a gain of 1.6 percent, contributing to its solid 28.6 percent gain for FY24. Additionally, in FY24, the Mid, Small, and Large-cap indices surged by 63 percent, 60 percent, and 32 percent, respectively.
On the global front, the week concluded with mixed market performances. European markets continued to rally and key US market indices showed divergent trends. However, the majority of Asian markets posted negative returns.
Bounce from oversold zone
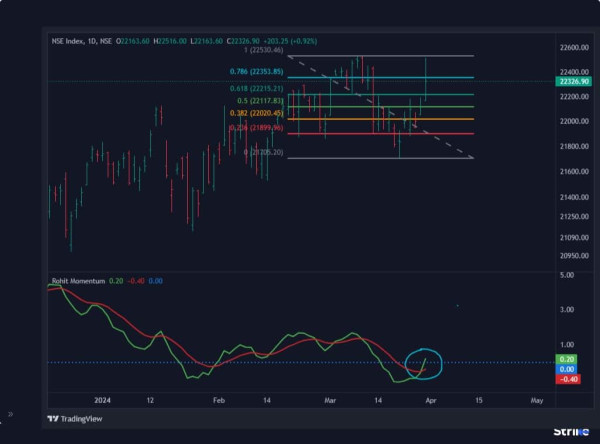
Nifty surpassed the 61.8 percent retracement level of the previous decline, 22214, and the daily RMI gave a bullish crossover on Thursday (see chart RMI Bullish crossover). Also, several sentiment indicators are turning around from the oversold zone. The recent high of Nifty at 22526 is a significant resistance level in the near term.
Momentum in Nifty will pick up once the high of 22526 is broken decisively. However, on the downside, it's reassuring to note that the daily swing low of 21947 is an important support level. This level should break if the short-term corrective phase is complete, providing a safety net for the Nifty stock.
RMI Bullish crossover
 Source: web.strike.money
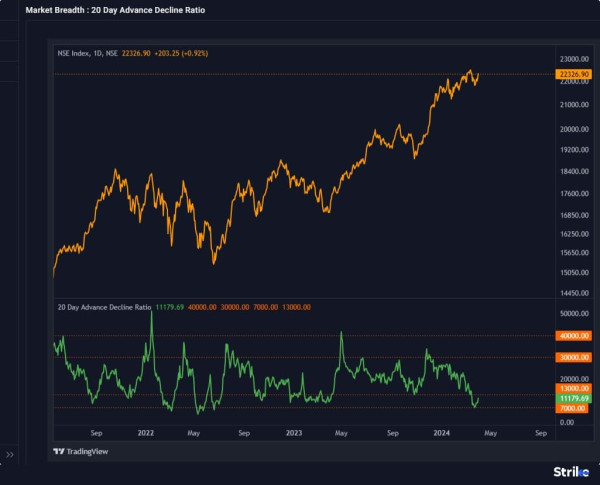
The market breadth has been weakening since December 2023, but in the middle of March 2024, the 20-Day A/D (Advance/Decline) ratio reached its extreme oversold zone (see chart Market Breadth). The recovery in the past couple of weeks has led to some improvement in breadth, and the overall market breadth is likely to improve further as the Nifty index breaks and sustains above the high of 22526.
Market Breadth
 Source: web.strike.money
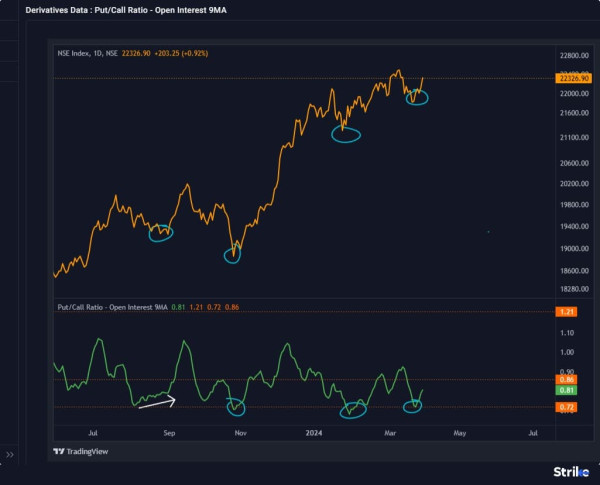
The market-wide nine day average OI PCR (Open Interest Put Call Ratio) has also rebounded from its oversold zone (see chart OI PCR), and the market has risen higher. Currently, the OI PCR reading stands at 0.81. The upper end of the range is around 1.05. It has meaningful room on the upside to rise higher from current levels. Rising OI PCR is bullish as the option writers are comfortable shorting more puts than calls, indicating limited downside in the near term.
OI PCR
 Source: web.strike.money
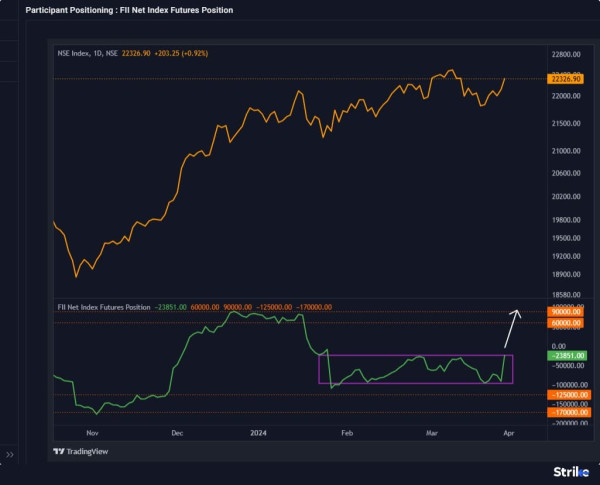
FIIs covered significant short positions in the index futures and created long positions on Thursday, resulting in a sharp decline of FIIs' net short position in the index futures from 90,796 contracts to 23,851 contracts (see chart FII activity). If the Nifty index breaks and sustains above the previous high of 22526, then the FIIs will end up covering short positions in the index futures and may even turn net long in the index futures.
The short-term indicators mentioned above have already hinted at an upmove. All we need is a price action breakout, which will be confirmed once the Nifty index closes above 22526.
FII activity
 Source: web.strike.money
Indices and Market Breadth
The strong performance for the week was thanks to the market rallying on the last day of the week. During the truncated week, the broader indices performed in line with the main indices. FII buying throughout the week helped the market.
FIIs turned net buyers this week, buying Rs 2368.76 crore and closing March with a net buying of Rs 3,314.47 crore.
Among broader indices, the Small-cap index closed 1.8 percent higher, and the Mid-cap index gained 1.4 percent.
Among the sectors, Nifty Realty was the top gainer, closing the week five percent higher, followed by Oil and Gas stocks, which gained by two percent, and Auto and Healthcare indices, which added 1.7 percent to the value.
There were non-performers, with Media stocks losing three percent in value and IT stocks closing the week marginally lower, sliding by 0.8 percent.
Among the top-performing stocks were Sanghvi Movers, which gained 17.42 percent; Bharat Bijlee, which was up 16.84 percent; and Technocraft Industries, which closed the week 16.33 percent higher.
The top losers for the week were EKI Energy, which lost 14.44 percent, Sanmit Infra, which lost 14.18 percent, and Primo Chemicals, which was down 12.12 percent.
A look at roll-over data shows that rollover for Nifty futures was 69.77 percent, much lower than the last three-month average of 76.79 percent. Bank Nifty had a much better rollover of 87 percent as against the three-month average of 79.52 percent.
Global Market
The US markets had a mixed performance, with the Dow Jones and S&P500 closing in positive territory while the Nasdaq closed marginally in red. US indices lost momentum after Fed officials said there was no hurry to reduce rates, resulting in rising bond yields.
The MSCI World index closed 0.28 percent higher during the week.
European markets continued to rally, with the Euro Stoxx 50 gaining 1.03 percent and the German markets leading the rally and closing the week with a gain of 1.64 percent. The highlight of the week was the UK falling into a technical recession, but what took the market higher was the data from the European Union showing that consumer confidence was the highest in two years.
Besides Hong Kong, all other Asian markets closed in the red, with the Nikkei 225 closing 1.27 percent lower due to the Japanese Yen touching a 34-year low.
Stocks to watch
Adani Ports, ICICI Prudential, Bharti Airtel, Tata Communications, Bajaj Auto, Titan, L&T and Reliance Industries are among the stocks that can witness upside momentum.
Asian Paints, Page Industries, Bandhan Bank, UPL, Bata India and SBI Card can remain under pressure during the week.
Cheers,Shishir Asthana