Moneycontrol Pro Market Outlook | Multiple indicators point to a possible market rebound
Dear Reader,
For the third consecutive week, Indian markets ended in the red, facing multiple challenges. A mix of weaker-than-expected quarterly earnings, persistent foreign institutional investor (FII) outflows, and the ongoing Middle East tensions contributed to the decline. While the BSE Sensex dipped by 0.19%, the Nifty50 lost 0.44%, and the mid-cap index shed 1%. However, banking stocks offered some relief, rallying during the week and preventing further falls in the benchmarks.
FII activity has been a significant pressure point, with relentless selling pushing their weekly outflows to Rs 21,823.34 crore. For the month, FII sales have reached Rs 80,217.90 crore, surpassing the previous high of Rs 65,816.70 crore seen during the peak of the COVID-19 crisis. With two weeks left in the month, the persistent FII exodus is becoming a notable concern for market stability.
Meanwhile, across the globe, the US markets posted a strong close, driven by better-than-expected corporate earnings and a positive retail sales report. All three major US indices gained around 0.9% for the week. Over in Europe, markets also fared better. The STOXX 600 closed 0.58% higher, with Italy's FTSE leading the charge with a 2.61% increase. Germany's DAX rose by 1.46%, and the UK's FTSE indices followed with gains of 0.46% and 1.27%, respectively.
European markets were buoyed by a rate cut from the European Central Bank (ECB). The ECB lowered its key deposit rate by 25 basis points to 3.25%, marking the first back-to-back reduction in 13 years. ECB President Christine Lagarde expressed optimism, noting that the disinflationary process was "well on track." Market expectations are now set for another rate cut in December.
In the UK, expectations are mounting for the Bank of England to lower borrowing costs after inflation slowed to 1.7% in September, its lowest level since April 2021.
In Asia, Japan's stock market took a 1.58% hit as exports fell by 1.7% in September, marking the first decline in 10 months due to weaker Chinese demand. In contrast, Chinese markets saw gains, with the Shanghai Composite up 1.36% after the central bank introduced more support measures to boost the economy. Core inflation in China, excluding food and energy, rose just 0.1%, the lowest since February 2021.
Multiple bottoming signals
Story continues below AdvertisementRemove AdNifty closed a third week lower, the longest losing streak in over a year. Most corrections ended in 1-2 weeks, but the longer fall was limited to the Nifty, as other indices like Bank Nifty closed positive for the week.
Despite the visible weakness in the Nifty, the overall strength of the broader market suggests a bullish outlook. The oversold conditions, which have deepened further, are reflected in indicators like the Nifty PCR (Put-Call Ratio), which currently sits at 0.65, the lowest since it hit 0.60 in June 2022. This extreme oversold reading signals the potential for a rebound, as low PCR levels often indicate heightened pessimism, creating conditions for a market turnaround.
A short-term indicator, the Daily Swing from India Charts did not make a lower low even as the Nifty closed lower on daily charts, resulting in a positive divergence over the last ten days. A similar positive divergence is present in the RSI indicator as well.
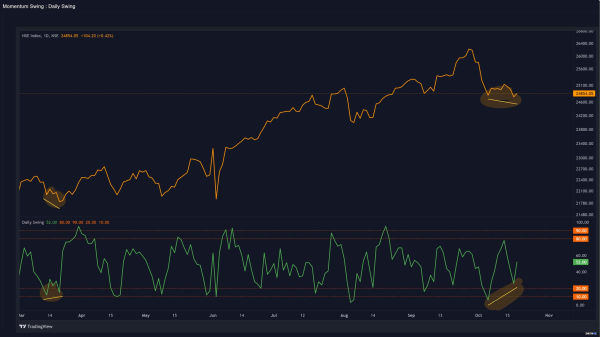
Daily Swing
Source: web.strike.money
The market's Put/Call ratio, taken on the basis of a 9-day moving average, has been languishing in oversold territory for a while now. These readings indicate a bottoming-out market, not one in free fall.
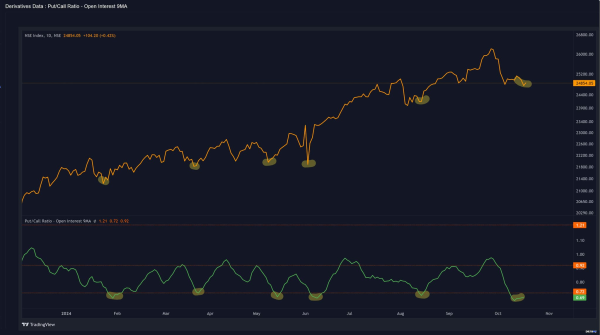
Put/Call Ratio
Source: web.strike.money
Clients' positioning in the Index futures segment shows growing long positions at lower levels. The net position is long and above the red line, where markets often bottom out. Clients as a category end up having significant long positions at most market lows. This is the exact opposite of FIIs, which are short.
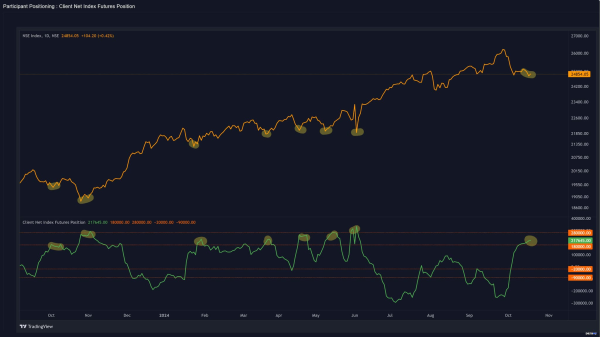
Client Net index Futures Position
Source: web.strike.money
Sector Rotation
The Weekly Relative Rotation Graph (RRG) from India Charts shows that Nifty Metal continues to see an increase in relative momentum, while Nifty PSE has fallen into the lagging quadrant, and PSU banks have weakened further.
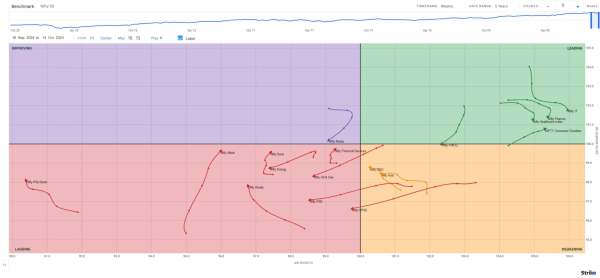
Weekly RRG
Source: web.strike.money
According to the Daily RRG chart, the markets had a mixed week, with more indices closing negative. Nifty IT, Pharma, and Healthcare continue to be in the leading quadrant, with a slight drop in momentum. Nifty PSE and PSU Banks have also entered the leading quadrant. FMCG weakened further and continues in the lagging territory.
Nifty Realty, Banks, Financial Services saw an increase in relative momentum with the financials entering the improving quadrant. Nifty Metal and Auto lost further momentum and are now in the weakening quadrant.
Stocks to watch
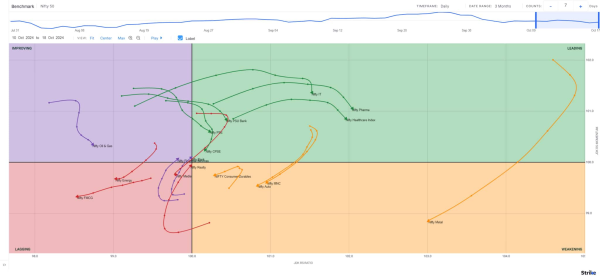
Daily RRG
Source: web.strike.money
Among the stocks expected to perform better during the week are Dixon, Tech Mahindra, MFSL, HCL Tech, HDFC Life, Hindalco, Sun Pharma, Page Industries, Mphasis, HDFC AMC, Persistent and IPCA Labs.
Among the stocks that can witness further weakness are Shree Cement, Nestle, IDFC First Bank and IndusInd Bank.
Cheers, Shishir Asthana