Moneycontrol Pro Market Outlook | Oversold indicators suggest further rally
Dear Reader,
Indian markets saw a strong recovery on Friday, buoyed by robust performances in the US and other global markets throughout the week. The benchmark indices in India closed the week with a gain of 0.7 percent.
The US markets extended their biggest weekly percentage gains of the year, fuelled by strong retail growth figures and optimism over a potential interest rate cut in September. The S&P 500 and Nasdaq marked their seventh consecutive week of gains following the Yen Carry trade incident two weeks ago. All three major US indices posted their largest weekly percentage increases since October 2023, with retail stocks leading the rally after retail sales surged to an 18-month high.
In Europe, the Stoxx 600 rose by 2.46 percent on expectations of another round of interest rate cuts in September. Germany's DAX gained 3.38 percent, France's CAC 40 increased by 2.48 percent, Italy's FTSE MIB climbed 4.09 percent, and the UK's FTSE 100 Index advanced 1.75 percent.
Japan's Nikkei 225 was the top performer, closing the week with an impressive gain of 8.7 percent, supported by the continued weakening of the Yen.
Following the US market surge, Friday's sharp rally highlighted the Indian market's reliance on global trends for short-term direction. Now, let's examine the market technicals.
Oversold indicators
After a two-week correction, the Nifty closed positively, reclaiming the 20-day moving average at 24,490. This positions the index for further recovery in the days ahead, especially after short-term sentiment indicators reached oversold levels, once we surpass 24,630, the path to 25,700 looks clear.
Story continues below AdvertisementRemove AdThe number of stocks in the Nifty 50 with MACD buy signals has dropped to its lowest level since October 2023, with only 6% showing buy signals, indicating that 94% of stocks are on sell signals. When everything appears bearish, it's often a signal to turn bullish, as reflected in the strong move on Friday.
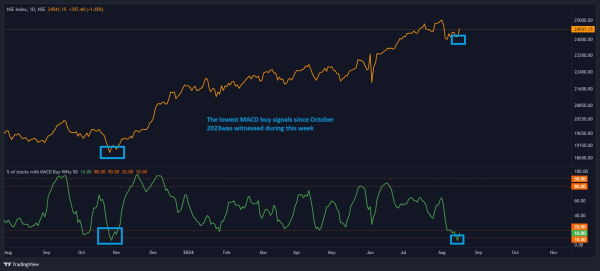
Source: web.strike.money
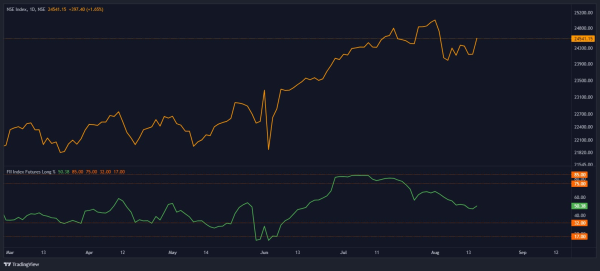
The Open Interest Put/Call ratio, calculated by dividing Puts' total open interest by Calls on a given day, indicates the market's bullish-to-bearish sentiment. We use a 9-day moving average of the data to obtain a smoother trend. Recently, this ratio dipped below the red horizontal line on the chart, signalling an oversold condition. Historically, similar readings have coincided with market bottoms over the past few years.
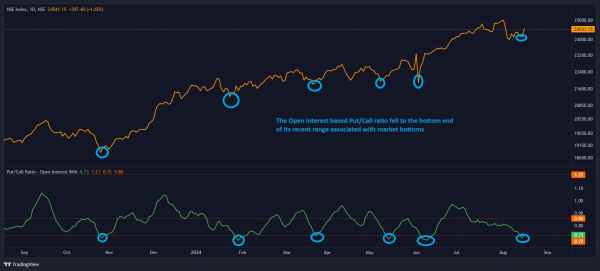
Source: web.strike.money
The 20-day advance decline ratio takes the total of advancing stocks on a particular day and divides it by the declining issues. A ratio with a wider lens is the 40-day average. Below, we explore the 20-day average, which is considered oversold near the two red lines at the bottom. This week, we reached the first red line for a second time in recent weeks, and there is a history of near-term bottoms close to this line.
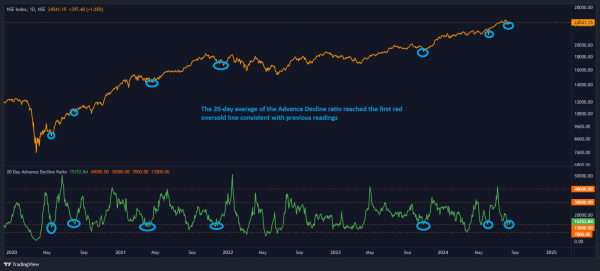
Source: web.strike.money
Sector Rotation
As mentioned in last week’s update, the IT sector experienced an increase in relative strength and momentum, contributing to this week’s gains. Other sectors in the leading quadrant include FMCG and Pharma, with momentum also picking up in the Oil & Gas and PSE indices.
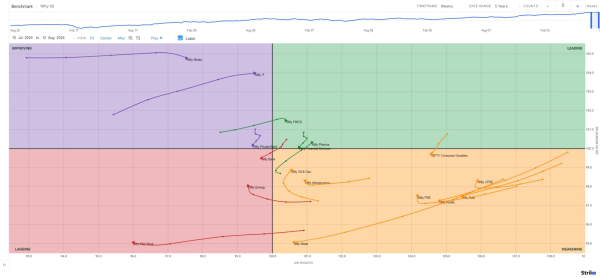
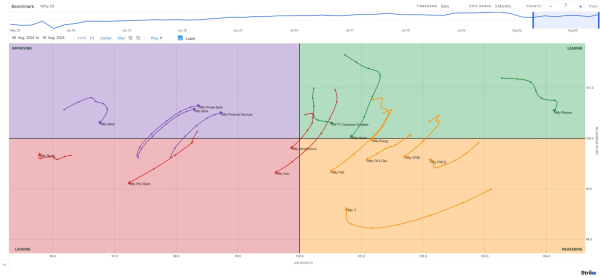
Weekly RRG
Source: web.strike.money
On the daily Relative Rotation Graph (RRG) from India Charts, the Nifty IT and FMCG showed an uptick in relative momentum but remained in the weakening quadrant. Nifty Pharma and Consumer Durables maintain their position in the leading quadrant. Financial stocks continued to improve in both relative strength and momentum and are still in the improving quadrant.
The Nifty Auto and Infrastructure lost Relative strength and relative momentum and are now in a lagging quadrant. Nifty Energy, PSE, CPSE, and media lost momentum, with most now entering the weakening quadrant.
Daily RRG
Source: web.strike.money
Indices and Market Breadth
Indian benchmark indices closed the week with a gain of 0.70 percent, led by the IT sector, which closed 4.70 percent higher. Mid- and small-cap stocks underperformed the main indices.
FIIs continue to sell in the cash market, touching sales of Rs 8616.26 crore during the week, making it Rs 28,976.91 crore for the month.
In the derivative market, FIIs covered some shorts but remain net short, as seen in the chart below.
Among the stocks in the derivative segment, Jubilant Foods was the top gainer, closing the week with a gain of 7.70 percent, Voltas closed 7.44 percent and Mphasis gained 7.00 percent.
The top loser during the week was Aarti Industries, which closed 19.39 percent lower. Sun TV lost 10.37 percent, and Zydus Life fell 8.71 percent.
Stocks to watch
Among the stocks expected to perform better during the week are TCS, Sun Pharma, Torrent Pharma, Ashok Leyland, Federal Bank, Bajaj Auto, ITC, Jubilant Foods, HCL Tech, Dr Lal PathLabs, HDFC AMC, Petronet and Cipla.
Among the stocks that can witness further weakness are RBL Bank, IDFC First Bank, IndusInd Bank, IDFC and Shree Cement.
Cheers,
Shishir Asthana