NASDAQ Index, SP500, Dow Jones Forecasts – Dow Jones Tests New Highs As Walmart Gains 6.7%
SP500

SP500 gained strong momentum as traders reacted to economic reports. Retail Sales increased by 1% month-over-month in July, while analysts expected that they would grow by just 0.3%. Initial Jobless Claims report showed that 227,000 Americans filed for unemployment benefits in a week, compared to analyst consensus of 235,000. NY Empire State Manufacturing Index improved from -6.6 in July to -4.7 in August. It should be noted that several reports missed analyst expectations. Industrial Production declined by 0.6% month-over-month in July, compared to analyst consensus of -0.3%. NAHB Housing Market Index decreased from 41 in July to 39 in August, compared to anlayst forecast of 43. However, these reports did not have any impact on market dynamics, as traders focused on the strong Retail Sales report.
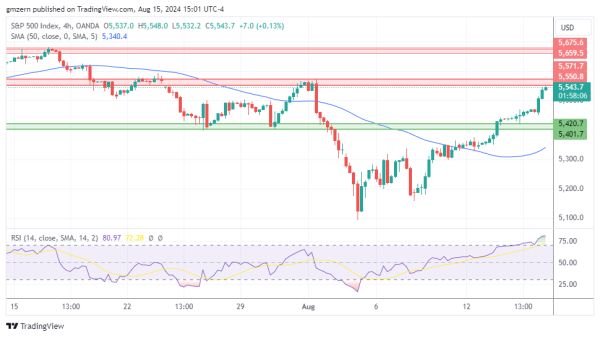
Currently, SP500 is trying to settle above the resistance at 5550 – 5570. In case this attempt is successful, it will head towards the next resistance level at 5660 – 5675. RSI is in the overbought territory, so the risks of a pullback are increasing.
NASDAQ

NASDAQ has also managed to gain strong upside momentum. Demand for chip stocks remains strong. Super Micro Computer, which is up by 9% today, is the biggest gainer in the NASDAQ index today.
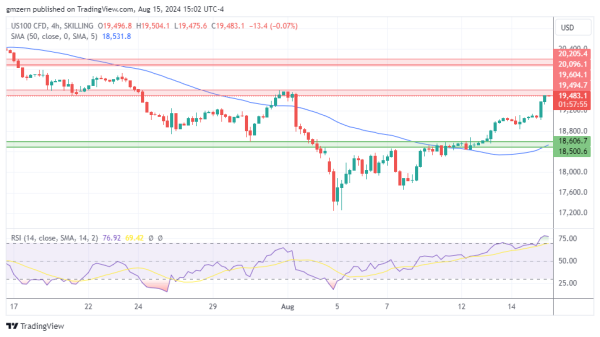
A successful test of the resistance at 19,500 – 19,600 will push NASDAQ towards the next resistance level, which is located in the 20,100 – 20,200 range.
Dow Jones

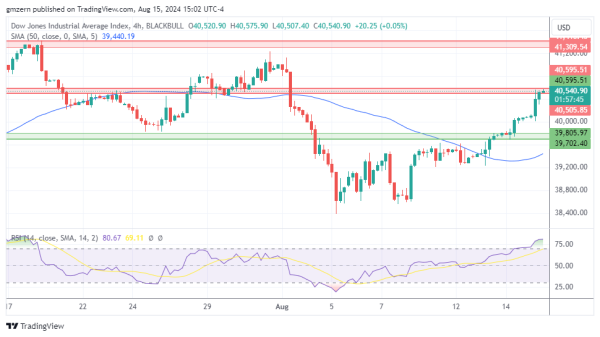
Dow Jones is trying to settle above the resistance at 40,500 – 40,600 amid broad rally in the equity markets. The rally is led by Walmart, which is up by 6.7% after the strong earnings report.
If Dow Jones manages to settle above the 40,600 level, it will head towards the next resistance at 41,300 – 41,400. It should be noted that Dow Jones is overbought, so the risks of a pullback are rising.
For a look at all of today’s economic events, check out our economic calendar.