NASDAQ, SP500, Dow Jones Forecasts: Tech Earnings Disappoint, Overbought Indices to Retrace?
Key Insights
- Tech earnings affect stock prices: Alphabet, Microsoft mixed, Tesla down, Starbucks surprises, AMD disappoints.
- Pre-market movements impact major indices: NASDAQ, S&P 500, Dow Jones, revealing market sentiment.
- Technical analysis provides insights: SPX SP500, Dow, and NASDAQ forecasts for potential trading strategies.
Tech Earnings Impact: Alphabet and Microsoft Down, Tesla Slumps, Starbucks Surprises, AMD Disappoints
The U.S. futures showed a mixed trend as investors absorbed earnings reports from leading tech firms ahead of the Federal Reserve’s policy meeting.
- Alphabet (NASDAQ:GOOGL) shares slid 5.5% as the company reported lower-than-expected holiday-season advertising sales and projected increased spending on artificial intelligence.
- Microsoft (NASDAQ:MSFT) witnessed a 0.7% drop despite surpassing quarterly earnings expectations due to concerns about rising costs for developing new artificial intelligence features.
- Tesla (NASDAQ:TSLA) saw a 2.8% decline after a U.S. judge invalidated CEO Elon Musk’s $56 billion pay package.
- Starbucks (NASDAQ:SBUX) defied expectations with a 3.7% stock price increase, despite revising down its annual sales forecast and warning of softer January demand.
- AMD (NASDAQ:AMD) shares fell 4.8% as its first-quarter revenue forecast and AI processor projections disappointed.
- Boeing (NYSE:BA) shares edged up 0.3% after the aircraft manufacturer delayed its 2024 outlook.
These premarket movements could impact forecasts for major indices like NASDAQ, S&P 500, and Dow Jones, providing insights into corporate earnings and market sentiment.
SPX SP500 Price Forecast
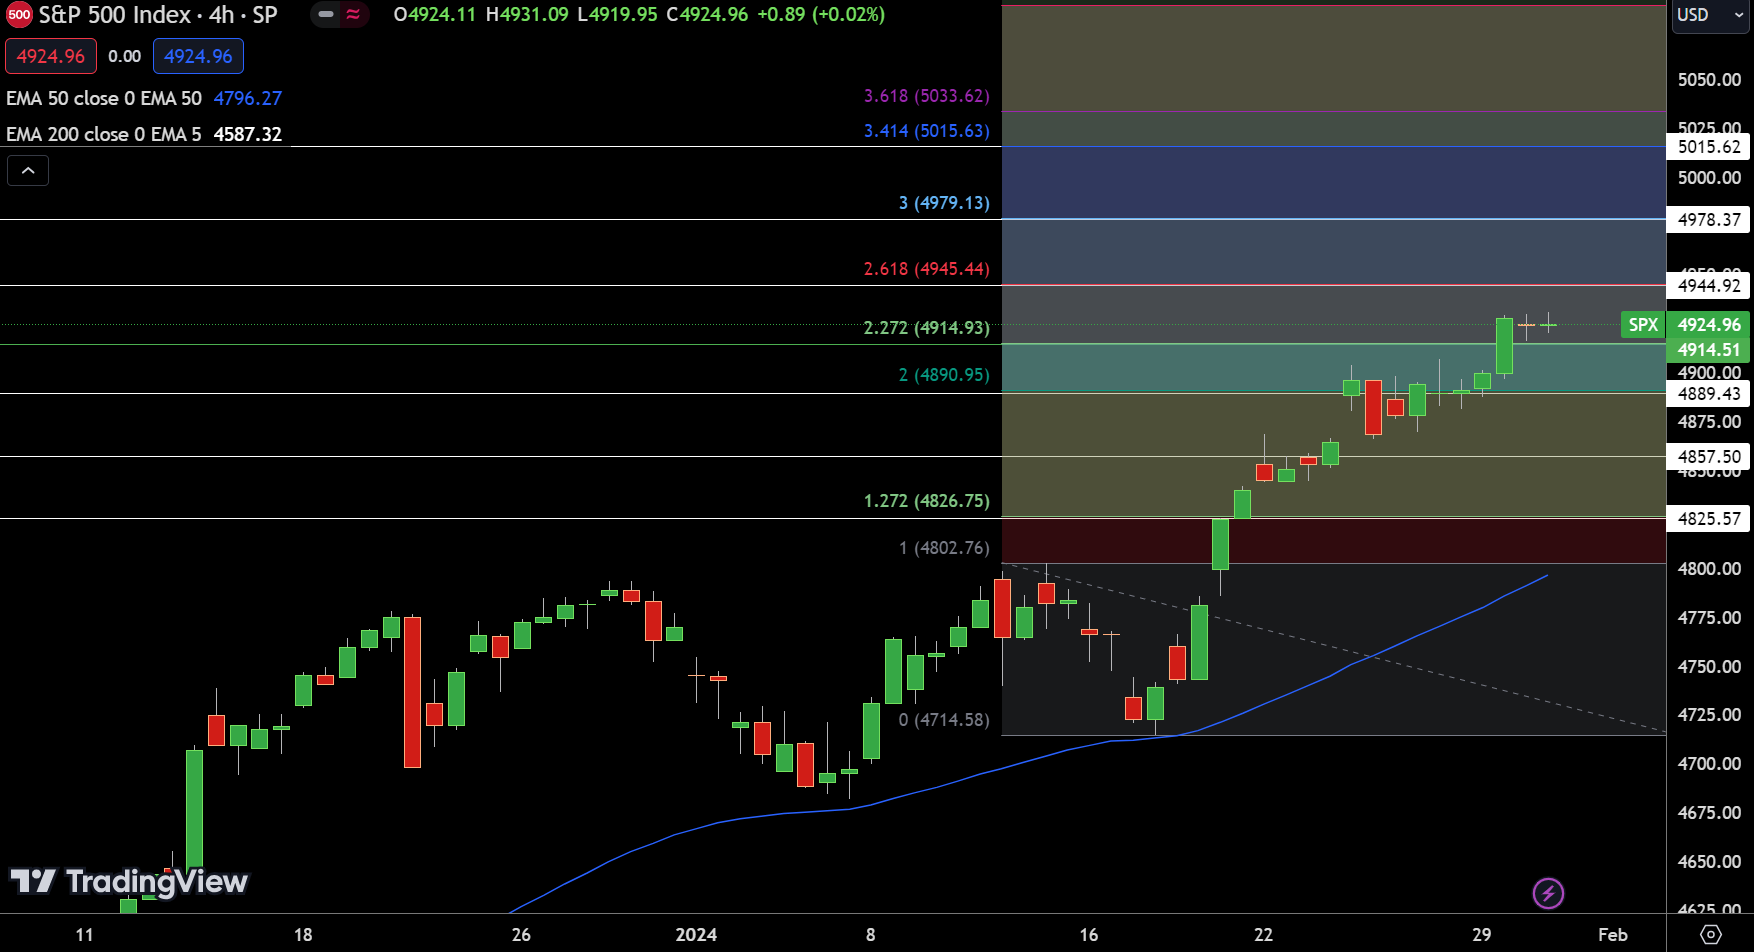
The SPX observed a slight decline, closing at $4924.96, a marginal 0.06% drop in the previous session. Key technical levels include a pivot point at $4914.51, with immediate resistance and support levels identified at $4944.92/$4978.37/$5015.62 and $4889.43/$4857.50/$4825.57, respectively.
Technical analysis reveals a bearish inclination below the resistance of $4944.92, highlighted by a doji and bullish engulfing candle patterns near $4924. This pattern suggests a potential bearish trend, with the SPX poised to challenge further resistance imminently.
Dow Price Forecast

The Dow Jones Industrial Average exhibits a bullish sentiment, as evidenced by a bullish engulfing pattern on the 4-hour chart and an upward trend channel. The technical analysis highlights a pivot point at $38,451.99, with immediate resistance levels at $38,557.59, $38,680.22, and $38,816.47.
Support is found at $38,336.18, $38,203.34, and $38,104.56. The 50-day and 200-day Exponential Moving Averages (EMAs) at $38,037.94 and $37,384.27 respectively, further support the bullish outlook.
Given these indicators, the Dow is positioned for upward momentum, particularly if it sustains above the pivot point of $38,451.99.
NASDAQ Price Forecast
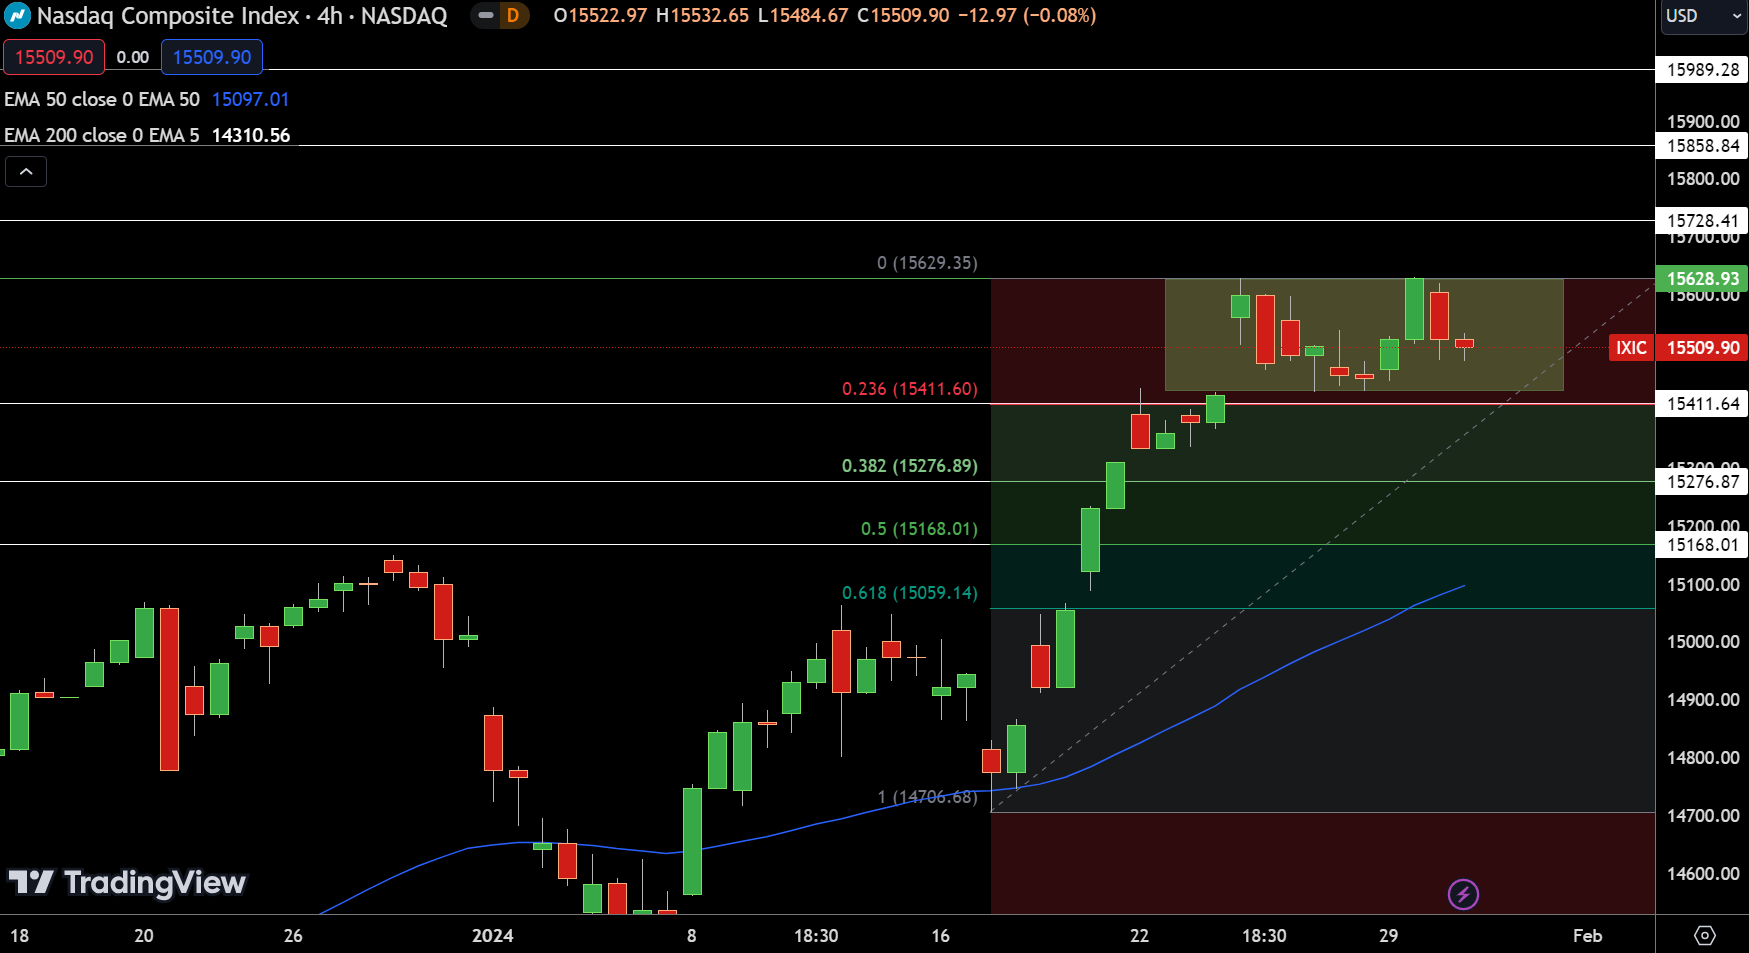
The NASDAQ faces resistance at the pivot point of $15,628.93, with higher resistance levels up to $15,989.28, indicating a potential downturn. Fibonacci retracements suggest supports down to $15,168.01.
The market’s overbought status, alongside the 50 EMA at $15,097.01 and the 200 EMA at $14,310.56, points to a bearish trend below the pivot.
This scenario forecasts a near-term test of resistance levels, influenced by technical indicators and current market conditions, signaling cautious trading strategies.
For a look at all of today’s economic events, check out our economic calendar.Advertisement