Natural Gas and Oil Analysis: EMAs Support Oil, IMF & Mid-East Tensions Stir Markets
Key Insights
- IMF’s positive global economic outlook and Middle East tensions bolster oil prices.
- US crude inventory expected to decrease, influencing USOIL and UKOIL markets.
- Natural gas shows bearish trend below pivot point, amidst fluctuating oil dynamics.
Oil Supported Amid IMF Outlook and Middle East Tensions
Oil prices gains support as International Monetary Fund (IMF) has raised its global economic outlook, suggesting a “soft landing” despite growth and trade below historic levels. Oil prices, influenced by China’s property sector woes and tensions in the Middle East, saw a rebound as President Biden hinted at a multi-tiered response to the conflict.
The upcoming OPEC+ meeting is not expected to adjust April’s oil supply. Additionally, a Reuters poll indicates a potential reduction in US crude inventories by 800,000 barrels.
These developments impact USOIL and UKOIL prices, alongside the broader natural gas market, reflecting geopolitical and economic dynamics.
Natural Gas Price Forecast
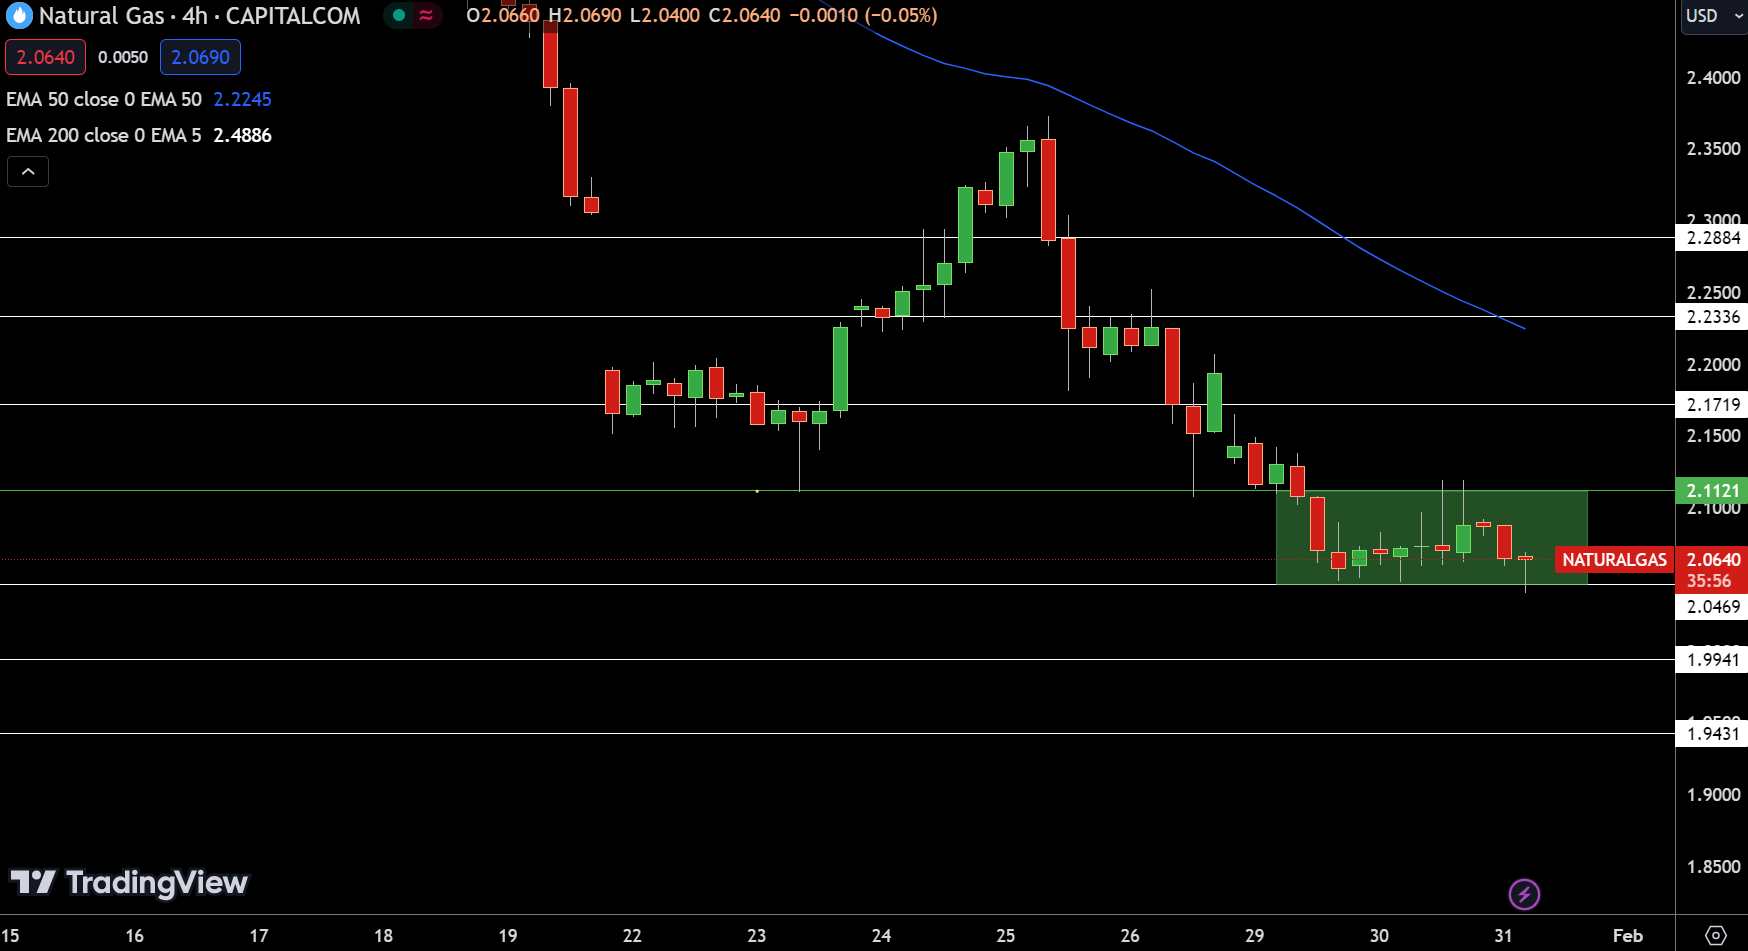
Natural Gas (NG) experienced a decline, trading at $2.0640, a decrease of 1.10% as of January 31. It’s currently below its pivot point of $2.1121, indicating bearish momentum.
Key resistance levels are set at $2.1719, $2.2336, and $2.2884, while support levels are found at $2.0469, $1.9941, and $1.9431. With the 50-Day and 200-Day EMAs at $2.2245 and $2.4886, respectively, the long-term trend appears bearish.
The market is trading sideways, awaiting a breakout from the current range to dictate future direction. The outlook remains bearish below $2.1121, suggesting cautious trading ahead.
WTI Oil Price Forecast
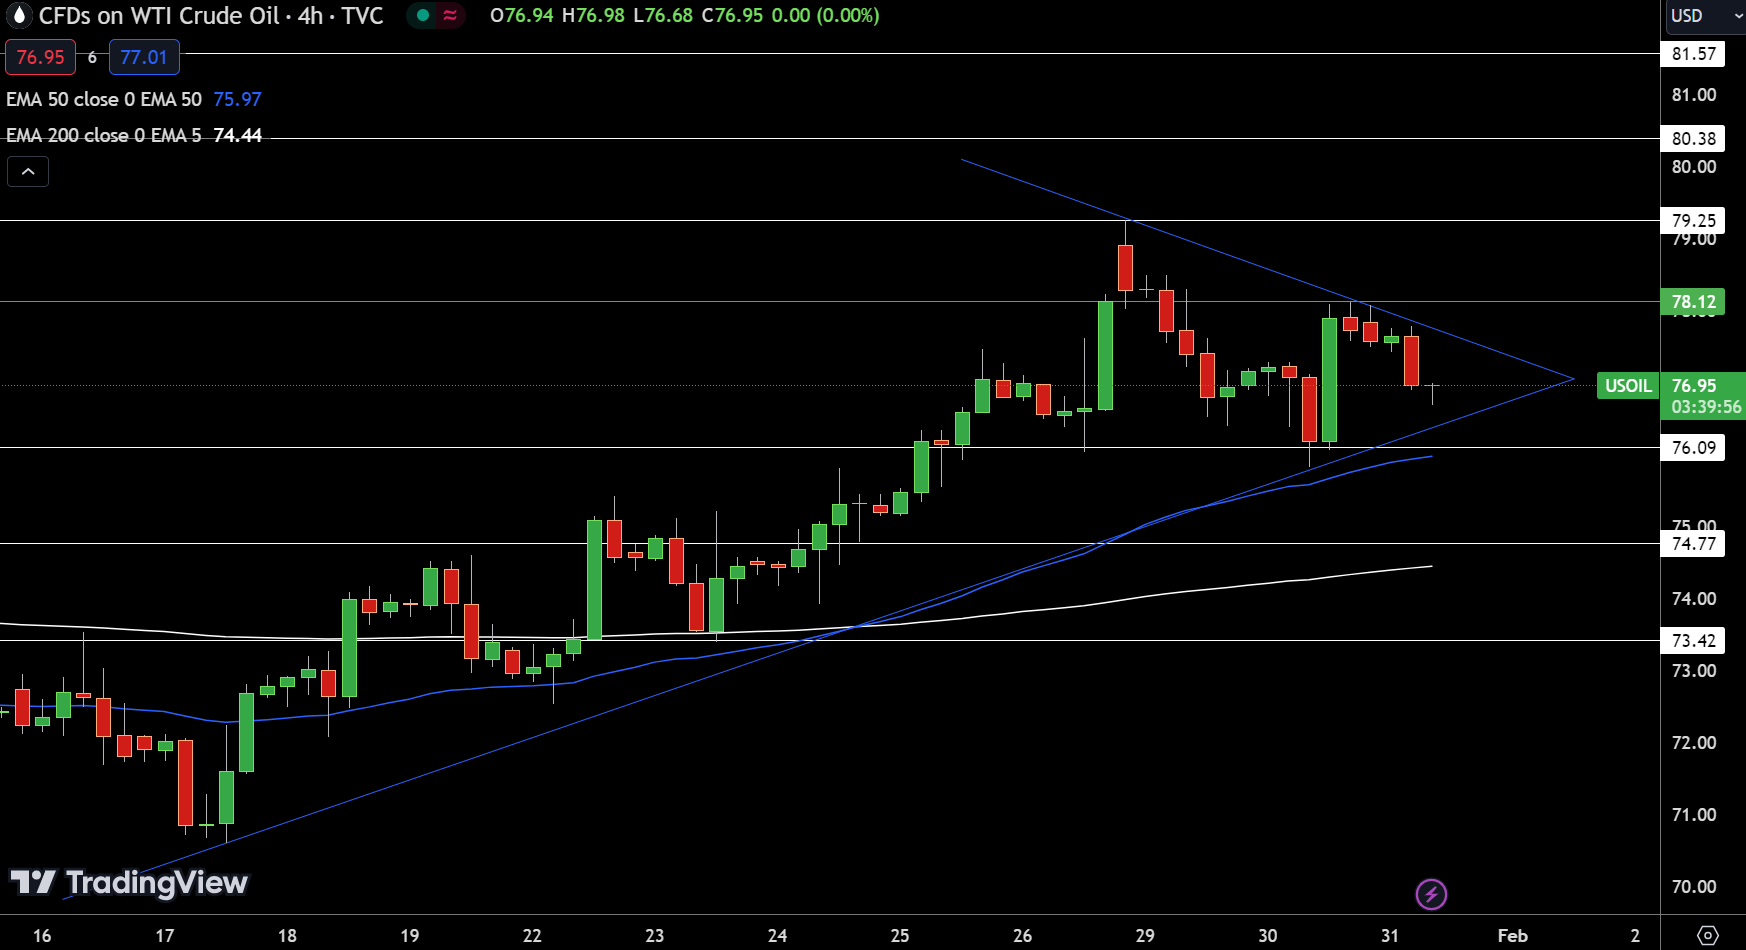
US Oil experienced a downturn, closing at $76.95 with a 1.08% decrease on January 31. It now hovers below its pivot point of $78.12, facing resistances at $79.25, $80.38, and $81.57, and supports at $76.09, $74.77, and $73.42.
A symmetrical triangle pattern identifies a consolidation phase, signaling a balanced fight between buyers and sellers. The 50-Day and 200-Day Exponential Moving Averages (EMAs) at $75.97 and $74.44, respectively, suggest underlying bullish potential if US Oil remains above these levels.
The market’s sentiment leans towards optimism, indicating possible upward movement if it sustains above the $76 mark, guided by technical patterns and key support levels.
Brent Oil Price Forecast
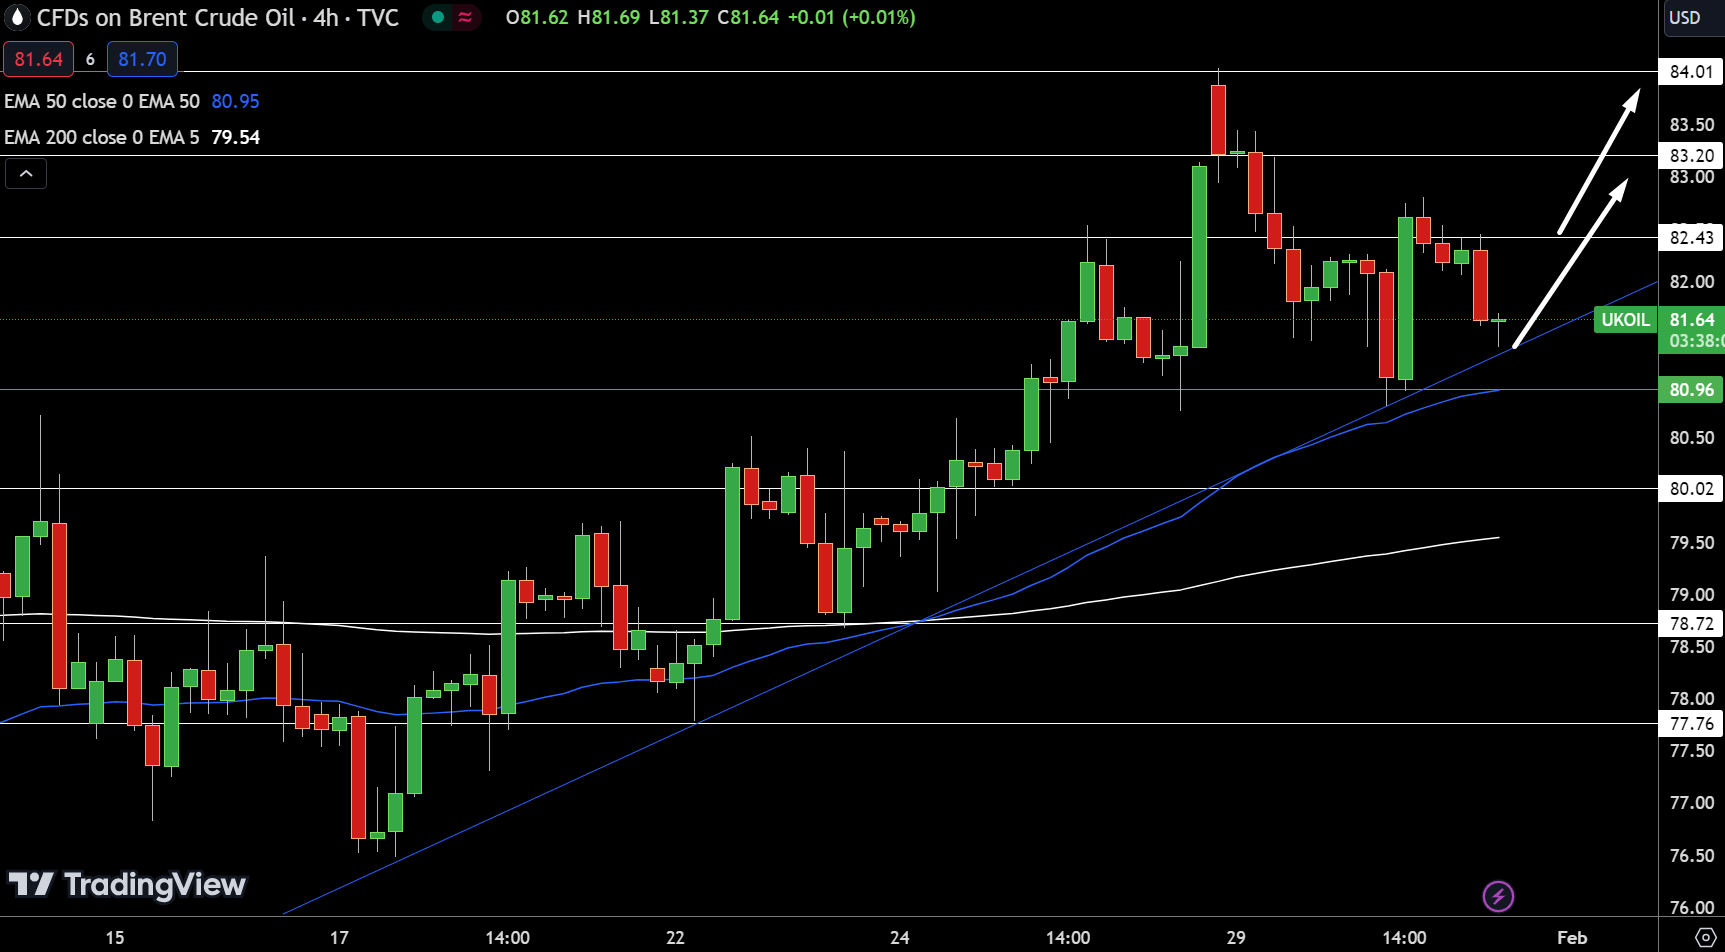
UK Oil’s technical landscape on January 31 reflects a slight retracement, with prices settling at $81.64, marking a 0.93% decrease. This movement situates the commodity slightly above its pivot point at $80.96, suggesting potential for recovery. Resistance levels are identified at $82.43, $83.20, and $84.01, indicating key barriers to an upward trajectory.
Conversely, support at $80.02, $78.72, and $77.76 delineates areas where buyers might re-emerge. The 50-Day and 200-Day EMAs, at $80.95 and $79.54 respectively, hint at underlying bullish sentiment, reinforced by an upward trendline suggesting resilience around the $81.65 mark.
The overall outlook remains bullish above the pivot, hinting at a continuation of the uptrend should prices sustain above $80.96.
For a look at all of today’s economic events, check out our economic calendar.Advertisement