Natural Gas and Oil Forecast: Adjustments Amid 2.7% US Inflation; Time to Buy?
Market Overview
Oil prices declined in early Asian trading on Monday, undoing Friday’s gains as peace talks in Cairo between Israel and Hamas eased Middle East tensions and U.S. inflation data reduced hopes for near-term interest rate cuts. Potential cease-fire developments had an impact on this subdued market opening by easing geopolitical tensions, which typically drive up oil prices.
High U.S. inflation rates at 2.7% for March, surpassing the Federal Reserve’s target, suggest persistently high interest rates, strengthening the U.S. dollar, and exerting downward pressure on commodity prices, including oil and natural gas.
Moreover, slowing industrial profit growth in China indicates weaker domestic demand in a key market, potentially dampening energy demand further. However, fluctuations in U.S. inventory levels and China’s manufacturing activity could still drive oil prices up later in the week.
Natural Gas Price Forecast
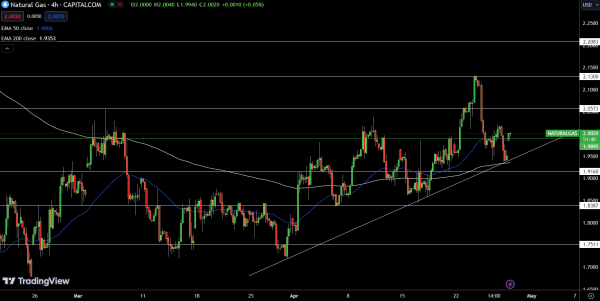
Natural Gas (NG) is trading at $2.00 per MMBtu, marking a gain of 2.61% for the day. The commodity has surpassed its pivot point at $1.99, suggesting a potential continuation of the bullish trend. Resistance levels are staged at $2.06, $2.13, and $2.21.
Should the price retreat, NG could find support at $1.92, with further potential pullbacks to $1.84 and $1.75. The technical setup is further supported by the 50-day Exponential Moving Average (EMA) exactly at the pivot point and the 200-day EMA at $1.94, both reinforcing the strength around these levels.
Given this configuration, NG remains bullish above $1.99, but slipping below this threshold could precipitate a sharp decline, underscoring a volatile market prone to rapid shifts in sentiment.
WTI Oil Price Forecast
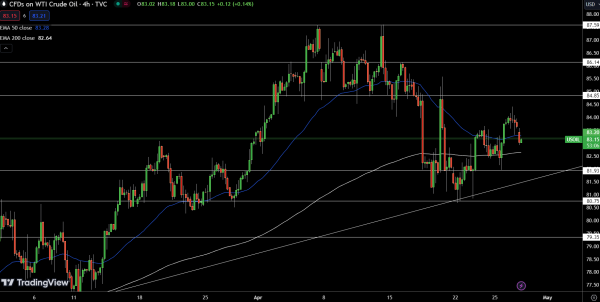
USOIL is currently priced at $83.15, reflecting a decrease of 0.61%. The commodity is trading near the pivot point of $83.20, which is critical for determining its next directional move. If it sustains above this level, USOIL could encounter resistance at $84.85, followed by higher thresholds at $86.14 and $87.59.
Conversely, a drop below the pivot could see the price testing support levels at $81.93, with further potential declines to $80.75 and $79.35.
Technical indicators like the 50-day EMA at $83.28 and the 200-day EMA at $82.64 provide additional context, suggesting a slight bullish bias but cautioning that a break below $83.20 could initiate a sharper selling trend.
Brent Oil Price Forecast
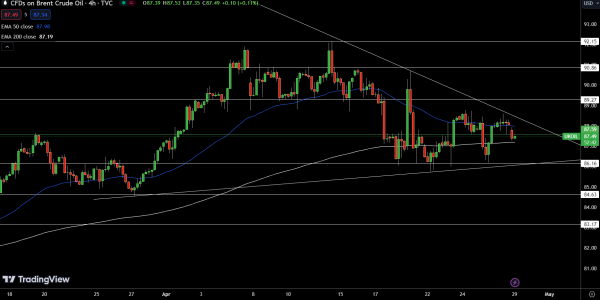
UKOIL is currently trading at $87.49, marking a decrease of 0.68%. The commodity is just below its pivot point of $87.59, a critical juncture that could dictate the next move in market dynamics. Should UKOIL climb above this level, it faces upward resistance at $89.27, with further barriers at $90.86 and a potential misprint that should likely be higher, not $82.15.
If it remains below the pivot point, initial support lies at $86.16, with subsequent supports at $84.63 and $83.17. The 50-day EMA and 200-day EMA, at $87.98 and $87.19 respectively, suggest that the market sentiment is somewhat mixed, with a close watch needed as prices hover near these important moving averages.
For a look at all of today’s economic events, check out our economic calendar.