Natural Gas and Oil Forecast: Ascending Trendline Support Oil; Buy Now?
Market Overview
Oil prices rebounded in Asian trading on Tuesday, finding support from the prospect of tightening supplies over the coming months, despite easing concerns of an Iran-Israel war which had previously escalated oil prices to near six-month highs.
The decline in geopolitical risk premiums in oil was linked to reduced fears of direct conflict between Iran and Israel, as Iran downplayed the impact of recent strikes and showed no immediate intent to retaliate.
However, the oil market remains underpinned by structural tightness, notably due to recent production cuts by Russia and steady U.S. fuel demand as the spring driving season kicks off.
Additionally, the U.S. is intensifying sanctions on Iranian oil exports, which could further strain global supply. This backdrop suggests a potentially bullish outlook for oil as driving season approaches, despite the current geopolitical ebb.
Natural Gas Price Forecast
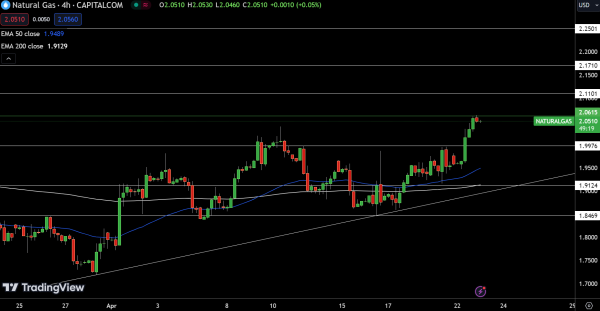
Natural Gas (NG) saw a modest decline in today’s trading session, falling 0.27% to a price of $2.051. The commodity is currently trading just below its pivot point at $2.06, suggesting a cautious market sentiment. If NG surpasses this level, it could indicate a shift towards a bullish trend.
Resistance levels are positioned at $2.11, $2.17, and $2.25, which could cap upward movements. Conversely, support levels are established at $2.00, followed by more substantial floors at $1.91 and $1.85, where buyers might step in.
The 50-day and 200-day Exponential Moving Averages at $1.95 and $1.91 respectively, suggest a potential for price stabilization or an upward correction if declines continue. The overall technical stance indicates a bearish bias below $2.06, but a break above could alter the market outlook to more bullish.
WTI Oil Price Forecast
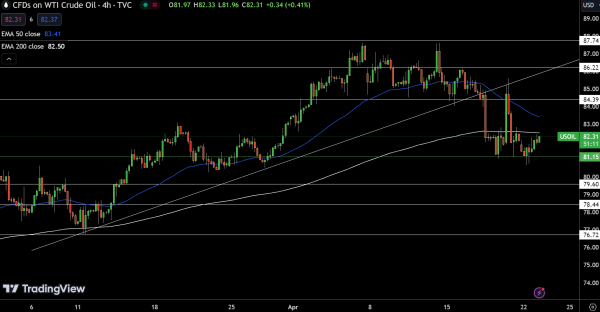
USOIL prices saw a modest increase today, trading at $82.31, up 0.28%. The asset hovers above its pivot point at $81.15, indicating a potential for continued bullish movement if it sustains above this level. Key resistance levels are identified at $84.39, $86.22, and $87.74, which could cap upward trends.
Conversely, support levels are established at $79.60, $78.44, and $76.22, where declines may find a floor. The 50-day and 200-day Exponential Moving Averages, at $83.41 and $82.50 respectively, support a positive bias.
Overall, the market posture is bullish above $81.15, with a break below this threshold possibly triggering a sharper sell-off.
Brent Oil Price Forecast
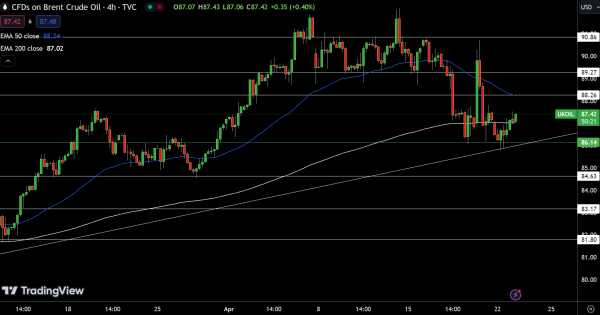
UKOIL price rose slightly to $87.42, marking a 0.33% increase. Positioned just above the pivot point at $86.14, the outlook remains bullish above this threshold. Resistance levels are set at $88.26, $89.27, and $90.86, potentially challenging further price advances.
Supports are identified at $84.63, $83.17, and $81.80, which may stabilize prices against downward movements. The 50-day Exponential Moving Average (EMA) at $88.24 and the 200-day EMA at $87.02 reinforce the current price dynamics.
The technical posture suggests that remaining above $86.14 is bullish, while a dip below could signal a significant sell-off.
For a look at all of today’s economic events, check out our economic calendar.