Natural Gas and Oil Forecast: Brent at $90.50, WTI $86.50; Upside Next?
Market Overview
Oil prices increased due to fading hopes for a ceasefire between Israel and Hamas, raising tensions in the Middle East. Brent crude futures climbed above $90.50, while West Texas Intermediate (WTI) crude reached above $86.50.
The geopolitical strain, especially with potential Israeli military actions in Gaza and Iran’s vow for retaliation, risks disrupting oil supply, impacting the market. This uncertainty supports a bullish trend for oil prices.
The situation also holds implications for the natural gas market, as regional conflicts can affect energy supply routes and demand, influencing both oil and natural gas forecasts.
Natural Gas Price Forecast
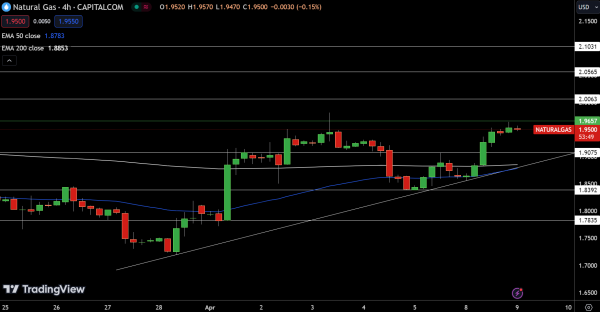
Natural Gas (NG) trades at $1.95, up by 0.26%. The pivot point stands at $1.97, indicating a potential shift in market sentiment at this level. Resistance is observed at $2.01, $2.06, and $2.10, while support levels are at $1.91, $1.84, and $1.78.
The 50-day and 200-day Exponential Moving Averages (EMA), at $1.88 and $1.89 respectively, are closely aligned, suggesting a consolidating market.
The outlook is bearish below $1.97, but crossing above this level could signal a turn towards bullish momentum. Market participants should watch these indicators closely for directional cues.
WTI Oil Price Forecast
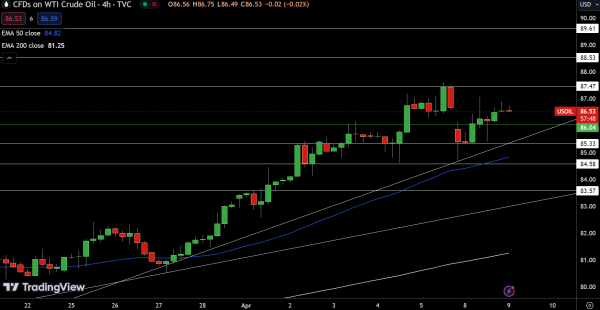
USOIL is slightly down at $86.53, a minor 0.04% decrease. The pivot point is at $86.04, indicating a bullish trend if sustained above this level. Key resistance points are identified at $87.47, $88.53, and $89.61, while support lies at $85.33, $84.58, and $83.57.
The 50-day Exponential Moving Average (EMA) stands at $84.82, supporting the current price level, and the 200-day EMA at $81.25 suggests a longer-term uptrend.
The market’s technical stance is bullish above $86.04, with a potential shift to bearish momentum if prices drop below this critical pivot.
Brent Oil Price Forecast
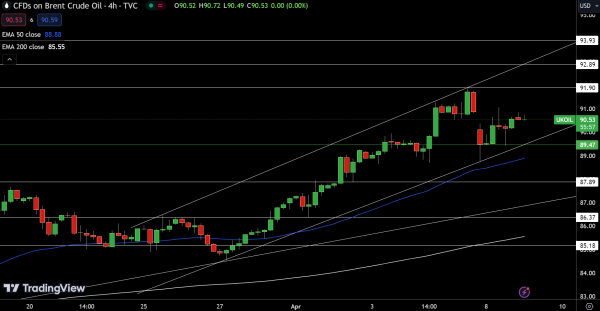
UKOIL is priced at $90.53, showing a marginal decrease of 0.02%. The pivot point at $89.47 serves as a crucial threshold; prices above this indicate a bullish outlook. Resistance levels are set at $91.90, $92.89, and $93.93, with support at $87.89, $86.37, and $85.18.
The 50-day Exponential Moving Average (EMA) is $88.88, suggesting near-term support, while the 200-day EMA at $85.55 reflects a stable long-term uptrend.
The technical posture is positive above the pivot point of $89.47, yet a fall below this could precipitate a significant bearish shift.
For a look at all of today’s economic events, check out our economic calendar.