Natural Gas and Oil Forecast: Brent Holds Near $90, NG Eyes $2
Market Overview
Following Iran’s attack on Israel, which resulted in limited damage, oil prices dropped slightly with Brent futures falling near $90 and WTI to $85. This decrease reflects a reduction in the risk premium that had increased in anticipation of the attack. .
Despite concerns of a wider conflict potentially disrupting oil flow through the Middle East, the immediate impact on oil supply has been minimal. Analysts suggest that any significant disruption could lead to the U.S. releasing more crude from its reserves and OPEC potentially utilizing its spare capacity to stabilize markets.
The situation remains fluid, with future oil and natural gas prices heavily dependent on further geopolitical developments and Israel’s subsequent actions.
Natural Gas Price Forecast
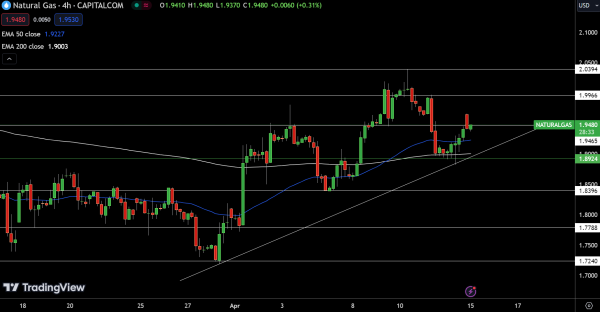
Natural Gas (NG) prices edged up to $1.94, marking a 0.31% increase. On the four-hour chart, the pivot point stands at $1.89, suggesting a cautiously bullish sentiment above this level. Resistance is mapped at $1.95, followed by psychological barriers at $2.00 and $2.04, which could cap further advances.
Support levels are positioned at $1.84, $1.78, and $1.72, with a break below the pivot potentially triggering a sharp decline. The 50-day Exponential Moving Average (EMA) at $1.92 and the 200-day EMA at $1.90 lend additional support, reinforcing the pivot point’s significance.
Overall, Natural Gas is poised for potential gains while remaining above $1.89, but risks of downside movement persist if it falls below this critical threshold.
WTI Oil Price Forecast
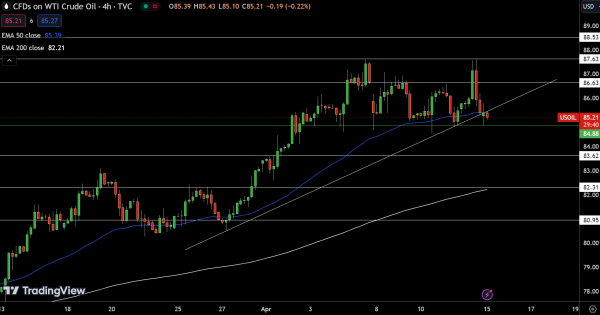
USOIL experienced a slight decline, trading at $85.20, down by 0.24%. The four-hour chart reveals a pivot point at $84.88, signaling a threshold for potential shifts in market dynamics. Resistance levels are established at $86.63, $87.63, and $88.53, posing challenges for upward movements.
Support lies lower at $83.62, with subsequent levels at $82.31 and $80.95 potentially halting further declines. The 50-Day Exponential Moving Average (EMA) is currently at $85.39, closely aligning with today’s price, while the 200-Day EMA at $82.21 underpins the broader bullish sentiment.
Conclusively, USOIL’s outlook remains positive above $84.88, though a descent below this pivot could trigger significant sell-offs.
Brent Oil Price Forecast
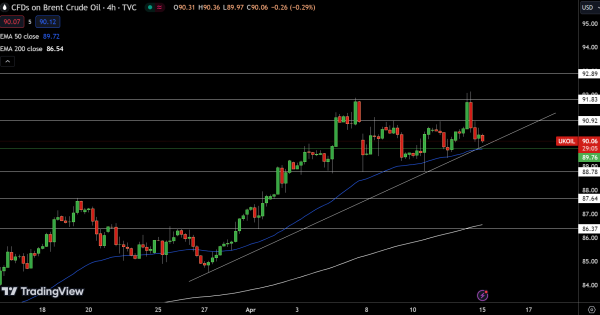
UKOIL is trading at $90.07, registering a modest decline of 0.09%. The technical analysis on the four-hour chart positions the pivot point at $89.76, which currently supports a mild bullish outlook if sustained. Immediate resistance levels are identified at $90.92, $91.83, and $92.89. A breakthrough above these could signal stronger bullish momentum.
Conversely, support levels are marked at $88.78, $87.64, and $86.37. Breaching these could lead to increased selling pressure. The 50-Day Exponential Moving Average (EMA) closely tracks the pivot at $89.72, while the 200-Day EMA at $86.54 provides additional foundational support.
Overall, the market posture for UKOIL is cautiously optimistic above $89.76, but vulnerability increases if prices fall below this critical juncture.
For a look at all of today’s economic events, check out our economic calendar.