Natural Gas and Oil Forecast: China’s GDP & Mideast Tensions to Drive Buying?
Market Overview
Oil prices saw an increase on Tuesday, driven by China’s GDP growth of 5.3% in the first quarter, surpassing expectations. This economic upswing in the world’s largest oil importer suggests a positive outlook for oil demand.
Concurrently, tensions in the Middle East escalated following Israel’s indication that it would respond to Iran’s missile and drone attacks.
This geopolitical unrest, coupled with China’s economic performance, is likely to influence the natural gas and oil markets significantly, potentially leading to sustained price volatility as the situation develops.
Natural Gas Price Forecast
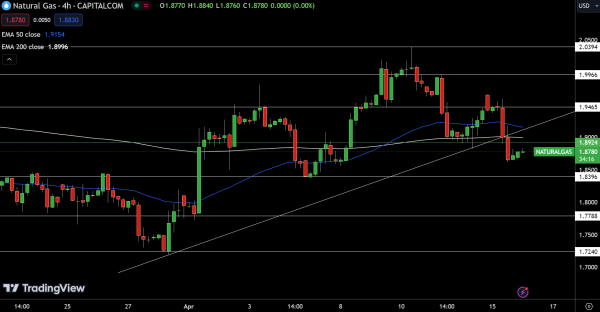
Today’s technical outlook for Natural Gas (NG) sees the commodity slightly up by 0.32%, trading at $1.8780. Positioned just below its pivot point at $1.89, NG displays potential for upward movement if it surpasses this threshold. The immediate resistance levels are set at $1.95, followed by $2.00 and $2.04. If these are breached, it could indicate further bullish momentum.
On the downside, should NG fall below the pivot, it could test support levels at $1.84, $1.78, and $1.72. Technical indicators suggest a cautious outlook; the 50-day and 200-day Exponential Moving Averages at $1.92 and $1.90, respectively, highlight a near-term resistance zone. The market stance will remain bearish below $1.89, with a potential shift to bullish above this critical level.
WTI Oil Price Forecast
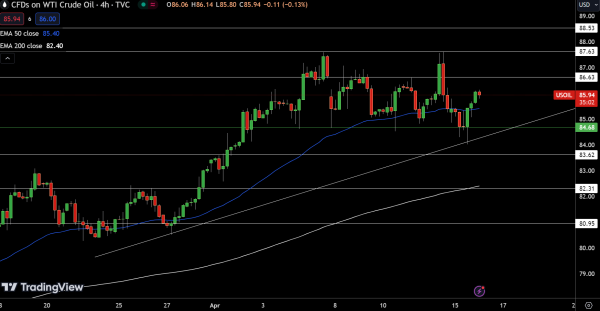
In today’s trading, USOIL marked a modest increase, with the price ascending to $85.94, reflecting a gain of 0.39%. The commodity remains positioned above its pivotal level of $84.68, signaling potential upward momentum. Immediate resistance is observed at $86.63, with further hurdles at $87.63 and $88.53.
Should these levels be surpassed, it may indicate continued bullish sentiment. Conversely, should the price fall below the pivot, support levels at $83.62, $82.31, and $80.95 are likely to be tested.
Technical indicators reinforce this outlook; the 50-day and 200-day Exponential Moving Averages, at $85.40 and $82.40 respectively, suggest a robust underpinning for current prices.
Brent Oil Price Forecast
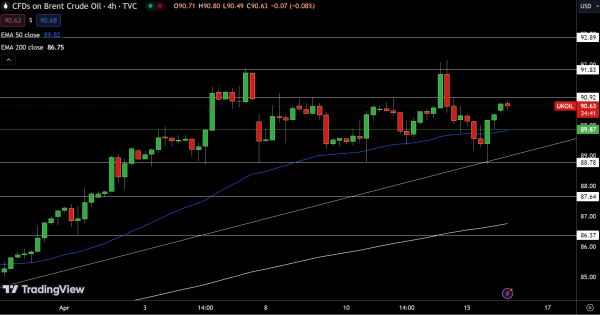
In today’s session, UKOIL has seen an uptick, with the price advancing to $90.63, an increase of 0.31%. The commodity is trading above its pivot point at $89.87, suggesting a potential for further gains. Resistance levels to watch are at $90.92, followed by $91.83 and $92.89. Overcoming these barriers could signal a continuation of the bullish trend.
Conversely, should UKOIL dip below its pivot, it might encounter support at $88.78, $87.64, and $86.37, which could arrest declines. Technical analysis supports a bullish stance above the pivot, with the 50-day and 200-day Exponential Moving Averages at $89.82 and $86.75 respectively, underpinning the upward trajectory.
For a look at all of today’s economic events, check out our economic calendar.