Natural Gas and Oil Forecast: Hurricane Francine Sparks Supply Concerns, Markets React
Market Overview
Oil prices rebounded slightly on Wednesday after significant drops, driven by fears of output disruption due to Hurricane Francine in the U.S. Gulf of Mexico, which shut down 24% of crude production and 26% of natural gas output.
This offset concerns over weakened global demand following OPEC+ revisions to future demand growth.
Meanwhile, U.S. crude inventories fell, providing additional support to prices. However, lingering economic slowdowns in China and the U.S. continue to exert downward pressure on forecasts for oil and natural gas, keeping the market volatile.
Natural Gas Price Forecast
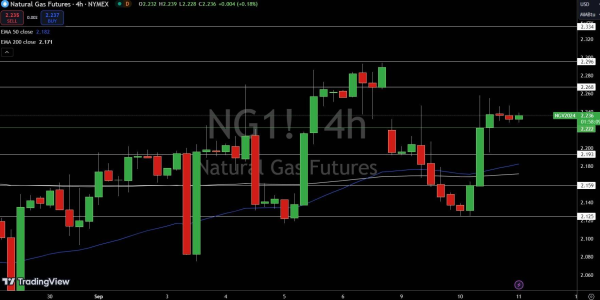
Natural Gas (NG) is trading at $2.236, holding steady with no significant movement, but showing some interesting technical signals. A series of Doji candles has formed just above the pivot point at $2.22, indicating indecision in the market but also a potential for an upward trend if buyers step in.
Immediate resistance is at $2.27, followed by $2.30 and $2.33, while support sits just below at $2.19, with further levels at $2.16 and $2.13.
The 50-day EMA is at $2.18, slightly above the 200-day EMA at $2.17, suggesting a slight bullish bias. If prices stay above $2.22, there’s a good chance for upward momentum, but a break below could signal a sharp sell-off.
WTI Oil Price Forecast
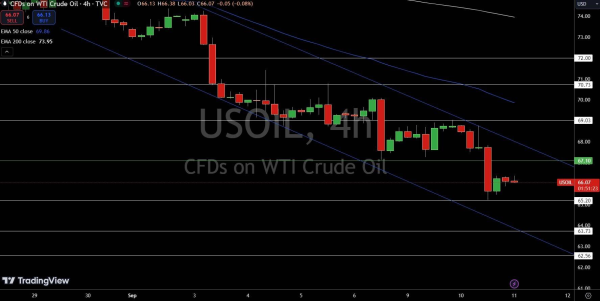
The US. Oil (USOIL) is trading at $66.07, slightly down by 0.25%, and hovering just below its pivot point of $67.10. The price action has been weak, unable to breach higher resistance levels. The immediate support is at $65.20, and if prices dip below this, there’s a strong possibility of further downside pressure.
The technical indicators reflect a bearish sentiment, with the 50-day EMA sitting at $69.86 and the 200-day EMA at $73.95, both well above the current price. This indicates that the momentum is firmly on the downside.
If prices manage to climb above $67.10, it could open the door to a potential upward shift. However, until then, the immediate resistance is at $69.03, with stronger resistance higher at $70.73.
Brent Oil Price Forecast
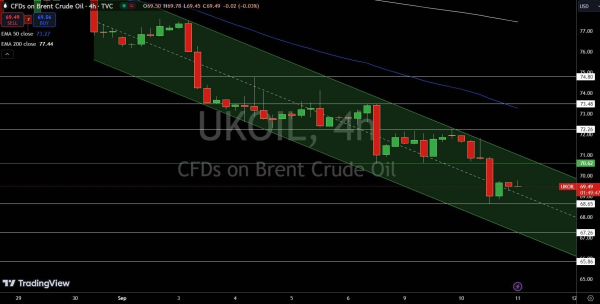
UK oil (UKOIL) is trading at $69.49, down by 0.14%, and remains stuck below its pivot point of $70.62. The market is currently moving within a downward channel, signaling that bearish momentum is still in play. Immediate support lies at $68.65, and a break below this level could open the door to further declines, with the next key support at $67.26.
On the upside, immediate resistance is at $72.76, with further barriers at $73.48 and $74.80.
The 50-day EMA at $73.27 and 200-day EMA at $77.44 both sit well above the current price, reinforcing the bearish outlook. A move above $70.62, however, could shift the momentum upward and boost bullish sentiment. Until then, downside pressure persists.