Natural Gas and Oil Forecast: Market Remains Cautious Amid Weak Demand from China
Market Overview
Oil prices dropped sharply, with WTI crude futures falling over 4% to below $69 per barrel as recent geopolitical actions in the Middle East seemed less disruptive to energy infrastructure than initially feared.
The restrained nature of the regional tensions has slightly eased concerns of immediate supply interruptions, although market volatility remains high. Adding pressure, weak economic data from China, a major energy consumer, signals dampened demand despite recent government stimulus.
Traders are also keeping a close eye on potential OPEC+ production changes and upcoming U.S. election impacts, both of which could further influence the energy market’s trajectory.
Natural Gas Price Forecast

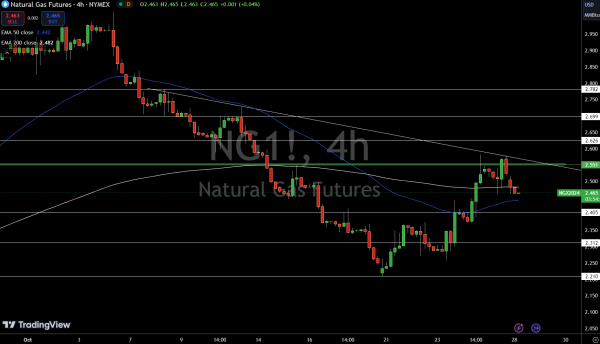
Natural Gas (NG) is trading at $3.02, slightly down by 0.59% today. Key levels are currently shaping its short-term direction. The pivot point at $2.55 is essential: if prices stay below this level, the bias leans bearish, with potential support at $2.41 and further at $2.31.
However, if prices manage to break above $2.55, that could signal a shift toward a bullish trend, with resistance targets at $2.63, $2.70, and ultimately $2.78.
Technical indicators add context to this outlook: the 50-day EMA at $2.44 and the 200-day EMA at $2.48 suggest some underlying support, but a decisive move above the pivot is needed for a clear bullish trend to take hold.
WTI Oil Price Forecast

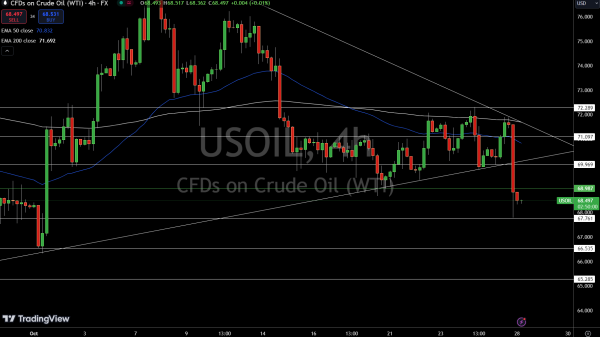
USOIL is trading at $68.52, up by 4.35%, but faces some key technical hurdles. The recent break below $70 has turned this level into resistance, adding weight to a potential bearish sentiment if prices stay under the pivot point at $68.99.
Immediate resistance now sits at $69.97, followed by $71.10 and $72.29, while support lies at $67.76, with further layers at $66.54 and $65.29.
Interestingly, the 50-day EMA is positioned at $70.83, with the 200-day EMA at $71.69, both suggesting a potential ceiling. A close above $68.99, however, could reinvigorate the bulls, signaling a fresh upward push. Until then, the bias remains cautious under this pivot level.
Brent Oil Price Forecast

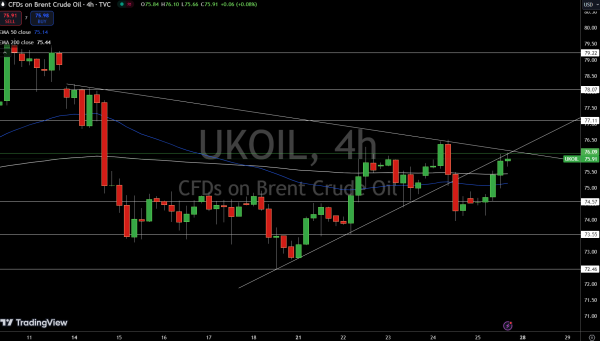
UKOIL, currently trading at $75.91 and up 1.91%, faces a pivotal moment. The $76 level, now acting as a resistance point, could be the gatekeeper to further gains. With the 50-day EMA at $75.14 and the 200-day EMA slightly higher at $75.44, the price action is tightly squeezed, creating a crucial threshold.
Immediate resistance levels stand at $77.11 and $78.07, with a stronger barrier at $79.22. Conversely, support is found at $74.57, followed by $73.55 and $72.46 below that. In short, if UK Oil can push decisively above $76.09, it may signal a fresh bullish run.