Natural Gas and Oil Forecast: Middle East Risks Elevate Bullish Oil Trends
Market Overview
Oil prices experienced a surge, driven by promising demand indicators from China and the U.S., alongside escalating Middle East tensions impacting supply concerns. Improved manufacturing activity in China and the U.S. hints at a robust demand rebound for oil.
Meanwhile, the conflict in Gaza, with Iran’s involvement, raises apprehensions about potential disruptions in oil supply. Upcoming OPEC+ meetings will be crucial in determining future supply cuts and production policies.
The compounded effect of geopolitical risks and demand recovery is poised to push oil prices higher, potentially affecting the broader energy market, including natural gas, as market dynamics shift.
Natural Gas Price Forecast
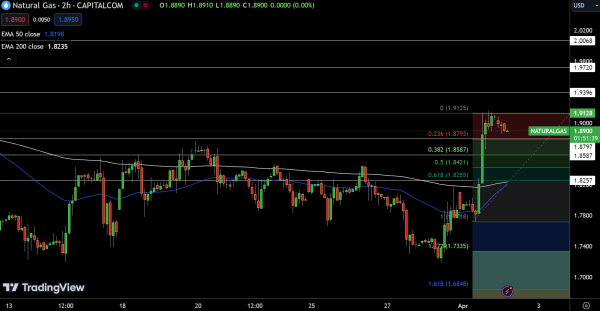
Natural Gas (NG) trades at $1.8950, marking a 0.68% decline, with a bearish outlook below the $1.9128 pivot point. Key resistance levels are at $1.9396, $1.9720, and $2.0068, while immediate support is found at $1.8797, followed by $1.8587 and $1.8257, coinciding with Fibonacci retracement levels.
The 50 EMA and 200 EMA, at $1.8198 and $1.8235 respectively, suggest a potential downward trend continuation. A shift above the pivot could introduce a bullish sentiment, but current indicators and Fibonacci levels emphasize a bearish trend for Natural Gas.
WTI Oil Price Forecast
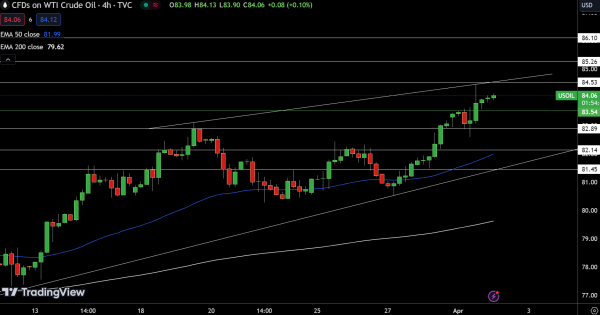
USOIL stands at $84.09, a slight increase of 0.21%. The pivot point is $83.54, acting as a vital marker for trend direction. Resistance levels are identified at $84.53, $85.26, and $86.10, while support levels are at $82.89, $82.14, and $81.45. The 50-day EMA at $81.99 and the 200-day EMA at $79.62 provide foundational support, hinting at a bullish trend.
However, the market remains sensitive to shifts, with a potential downturn if it falls below the pivot. The overall sentiment is bullish, but with a keen eye on the pivotal $83.54 mark to sustain momentum.
Brent Oil Price Forecast
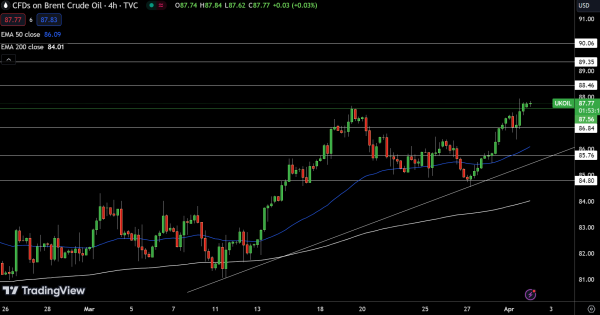
UKOIL is trading at $87.81, marking a modest increase of 0.08%. The pivotal price is set at $87.56. Resistance levels ascend at $88.46, $89.35, and $90.06, while support tiers descend at $86.84, $85.76, and $84.80.
The 50-day EMA at $86.09 and the 200-day EMA at $84.01 bolster a bullish sentiment, further confirmed by a bullish engulfing candle pattern.
The technical landscape leans towards an upward trajectory, maintaining bullishness above the $87.56 threshold. However, a dip beneath this pivot could catalyze a sell-off, urging traders to monitor closely.
For a look at all of today’s economic events, check out our economic calendar.