Natural Gas and Oil Forecast: Middle East Tensions Spike, Iran in Focus
Market Overview
Oil prices climbed, reflecting market concerns about the escalating Middle East crisis, potentially involving Iran, a major OPEC oil producer. The tensions, fueled by recent events in Gaza, have heightened fears of supply disruptions.
Geopolitical developments are making markets wary, with potential impacts on global oil supply lines. As geopolitical uncertainty lingers, oil prices may continue to be volatile, affecting both the oil and natural gas forecasts.
The situation underscores the fragile balance in energy markets, where regional conflicts can significantly influence global energy prices and supply stability.
Natural Gas Price Forecast
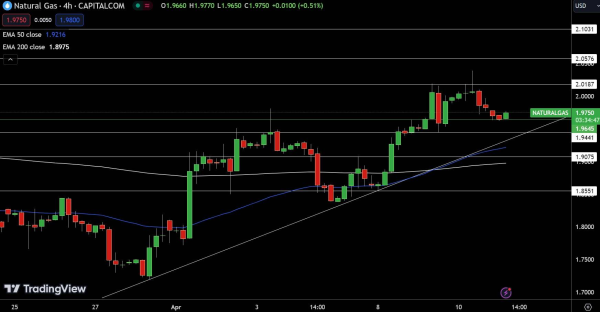
Natural Gas (NG) is trading at $1.97, showing a decline of 0.35%. The pivot point is set at $1.96, with the market watching for reactions at this level. Resistance levels are spotted at $2.01, $2.05, and $2.10, dictating the ceiling for potential upswings.
Support levels are identified at $1.94, $1.90, and $1.85, which could provide bounce-back points during dips. Technical analysis highlights the 50 EMA at $1.92 and the 200 EMA at $1.89, suggesting a bullish trend above $1.96.
However, falling below this pivot might trigger a significant bearish movement in the Natural Gas market.
WTI Oil Price Forecast
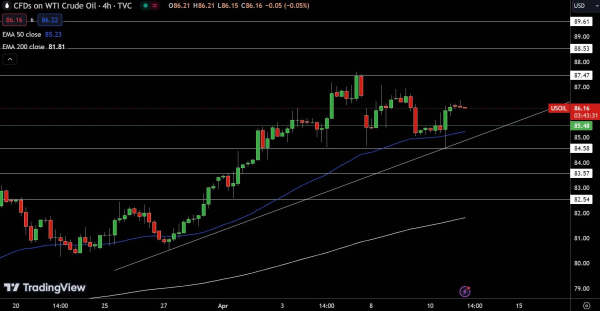
USOIL’s trades at $86.16, showing a marginal decline of 0.06%. The price action remains around the pivot point of $85.48, indicating potential for movement in either direction. Key resistance levels are set at $87.45, $88.53, and $89.61, which could cap upward movements.
Conversely, support levels at $84.58, $83.57, and $82.54 offer a cushion against further declines. Technical indicators, including the 50-day EMA at $85.23 and the 200-day EMA at $81.81, suggest underlying strength. The market sentiment is bullish above $85.48, but falling below this could trigger a sharp selling trend.
Brent Oil Price Forecast
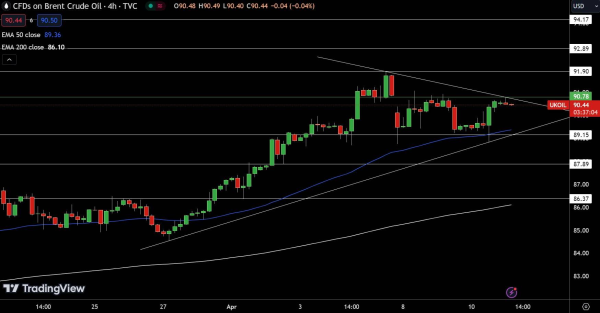
UKOIL is currently priced at $90.45, reflecting a slight decrease of 0.19%. The market is observing the pivot point at $90.78 closely, with resistance levels identified at $91.90, $92.89, and $94.17. These thresholds will challenge any upward momentum.
On the downside, support is found at $89.15, $87.89, and $86.37, providing potential stabilization points. Technical analysis shows the 50-day EMA at $89.36 and the 200-day EMA at $86.10, indicating a bearish trend below $90.78.
For a look at all of today’s economic events, check out our economic calendar.