Natural Gas and Oil Forecast: Middle East Tensions Spike Prices, What’s Next?
Market Overview
Oil prices surged by $3 per barrel on Friday following reports of Israeli missile strikes on Iran, raising alarms over potential disruptions in Middle East oil supply.
This development has escalated geopolitical tensions, with fears of further escalations affecting the stability of oil supply chains. U.S. and global media reported explosions in Isafahan, Iran, causing disruption in air traffic and increasing uncertainty in oil markets.
These events underscore the fragile nature of oil supply stability in the region, directly influencing daily forecasts for oil and potentially impacting natural gas markets due to the interconnected nature of global energy supplies.Natural Gas Price Forecast
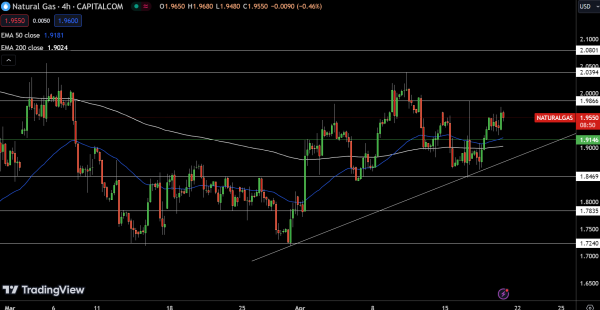
Today’s Natural Gas (NG) market shows a mild uptick, with prices rising to $1.9550, marking a 0.67% increase. This commodity is trading above its pivot point at $1.91, suggesting a potential for bullish momentum if sustained. Resistance levels are eyed at $1.99, $2.04, and $2.08, which could cap further advances. On the flip side, support is found at $1.85, with further supports at $1.78 and $1.72 that may provide a floor if declines intensify.
The technical indicators, including a 50-Day Exponential Moving Average (EMA) at $1.92 and a 200-Day EMA at $1.90, underscore the current trading zone just above key support levels. The outlook remains bullish above $1.91, but a drop below this critical juncture could trigger a sharp downward correction in the natural gas market.
WTI Oil Price Forecast
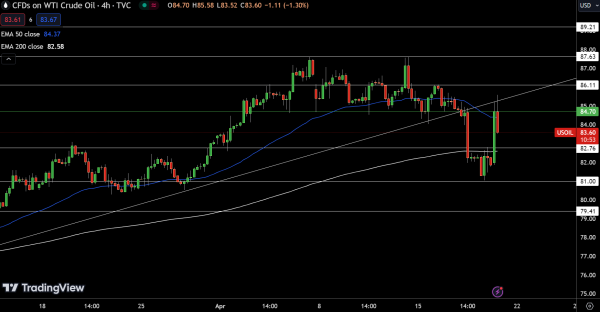
USOIL sees an uptick today, priced at $83.60, marking a 2.05% increase. The commodity is trading below its key pivot point at $84.70, which is critical for determining the day’s momentum. Resistance levels are set at $86.11, $87.63, and $89.21. A break above these could signal further bullish sentiment. Conversely, support levels are firm at $82.76, $81.00, and $79.41, with declines below these potentially intensifying bearish trends.
Technical indicators show the 50-Day Exponential Moving Average (EMA) at $84.37 and the 200-Day EMA at $82.58, providing near-term resistance and support respectively. The Relative Strength Index (RSI) details are pending but will further clarify momentum. The current technical stance is bearish below $84.70; however, overcoming this level could tilt to a bullish outlook.
Brent Oil Price Forecast
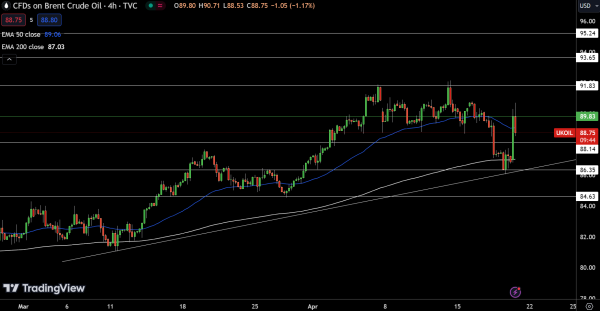
UKOIL shows a positive shift today, currently trading at $88.75, a 2.01% increase. Positioned just below the pivot point of $89.83, the oil price navigates key technical levels that will determine the market’s direction. Resistance levels are set at $91.83, $93.65, and $95.24. A move past these points could suggest a strengthening bullish trend. Conversely, support at $88.14, $86.35, and $84.63 will be crucial in cushioning any potential pullbacks.
The 50-Day Exponential Moving Average (EMA) at $89.06 and the 200-Day EMA at $87.03 provide additional context to the current market dynamics. The outlook remains bearish below $89.83, with a break above this level potentially indicating a shift towards a bullish bias.
For a look at all of today’s economic events, check out our economic calendar.