Natural Gas and Oil Forecast: Middle East Tensions Underpin Energy Sector
Market Overview
Oil prices increased on Friday due to rising tensions in the Middle East, potentially disrupting supply from the oil-rich region. Despite this uptick, oil is poised for a weekly decline influenced by the reduced likelihood of U.S. interest rate cuts this year.
The situation escalated following a suspected Israeli airstrike on Iran’s embassy in Damascus, with Iran vowing retaliation. Such geopolitical risks, alongside OPEC+’s supply cuts and improving global economic conditions, have significantly impacted oil price forecasts.
However, ongoing U.S. inflation concerns temper these gains, suggesting a cautious outlook for the oil market.
Natural Gas Price Forecast
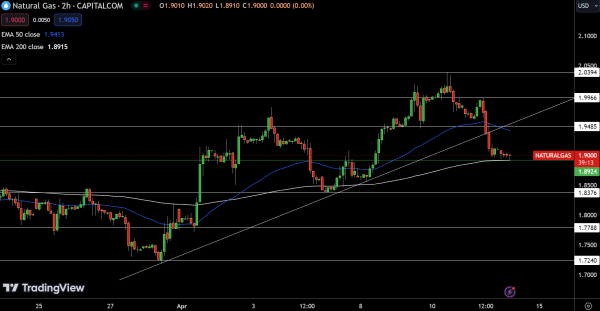
Today’s analysis of Natural Gas (NG) reflects a decrease, with the price falling to $1.90, down by 0.52%. The pivot point stands at $1.89, critical for maintaining a bullish stance. Resistance levels are set at $1.95, $2.00, and $2.04, suggesting possible ceilings for upward movement.
On the downside, support is identified at $1.84, with additional layers at $1.78 and $1.72 that could arrest further declines. Both the 50-Day Exponential Moving Average at $1.94 and the 200-Day EMA at $1.89 underline this pivot, indicating potential price stability.
However, a break below $1.89 could lead to a sharp selling trend, warranting vigilant market monitoring.
WTI Oil Price Forecast
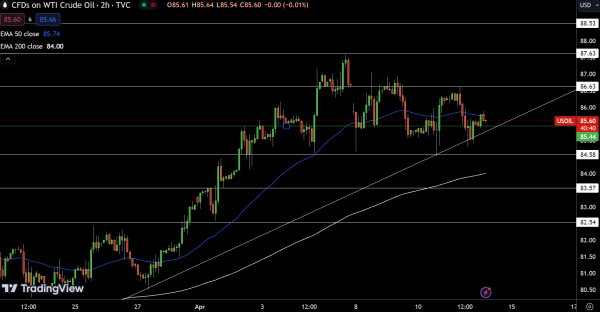
Today’s technical outlook for USOIL indicates a slight increase, with the current price marked at $85.60, up by 0.13%. The critical pivot point stands at $85.44, setting a baseline for bullish sentiment above this threshold.
Resistance levels are identified at $86.63, $87.63, and $88.53, respectively, offering potential hurdles in upward movement. Support levels to watch are $84.58, $83.57, and $82.54, providing cushions against downward trends.
The 50-Day Exponential Moving Average at $85.74 slightly surpasses the pivot, suggesting underlying strength, while the 200-Day EMA at $84.00 further bolsters support.
A break below the pivot point could trigger a notable selling trend, highlighting the need for vigilance around this key level.
Brent Oil Price Forecast
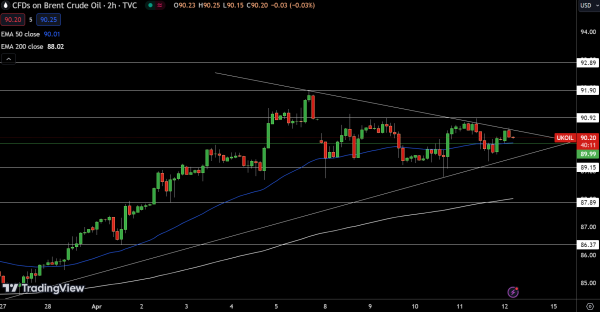
Today’s assessment of UKOIL reveals a modest uptick to $90.20, a gain of 0.06%. The established pivot point at $89.99 marks a crucial juncture; trading above this level suggests a bullish outlook. The chart shows resistance levels at $90.92, $91.90, and $92.89 that may challenge further advances.
Conversely, support is positioned at $89.15, with further buffers at $87.89 and $86.37 potentially stabilizing any declines. The 50-Day Exponential Moving Average closely aligns with the pivot at $90.01, reinforcing current levels, while the 200-Day EMA at $88.02 supports a longer-term bullish trend.
Should prices fall below $89.99, a sharp selling trend could be triggered, necessitating cautious monitoring.
For a look at all of today’s economic events, check out our economic calendar.