Natural Gas and Oil Forecast: Oil Corrects; Is Now the Time to Buy?
Market Overview
Oil prices remained stable on Wednesday, balancing the impact of ongoing tensions in Gaza against a larger-than-expected rise in U.S. crude stocks. The uncertainty in Middle East, particularly the Gaza ceasefire talks, threatens the stability of oil supplies, influencing global oil market sentiments.
Despite these geopolitical tensions, the increase in U.S. crude inventories has somewhat tempered the market rally. The continued conflict in Gaza risks broader regional involvement, affecting oil production and prices.
Natural Gas Price Forecast
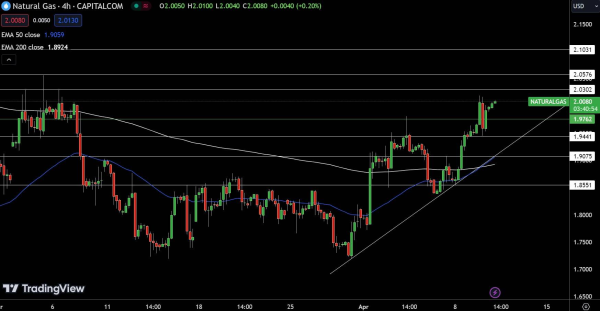
Natural Gas (NG) is trading at $2, marking a 0.20% increase. The pivot point stands at $1.97, indicating potential for upward movement with immediate resistance levels at $2.01, $2.05, and $2.10.
If NG surpasses these, further gains could be anticipated. Support levels are identified at $1.94, $1.90, and $1.85, where price stabilization or reversals may occur. The 50-day and 200-day EMAs, at $1.90 and $1.89 respectively, underscore a tight trading range, suggesting a consolidation phase.
The market outlook for NG is bullish above the $1.97 threshold; however, a drop below this point could initiate a significant sell-off trend.
WTI Oil Price Forecast
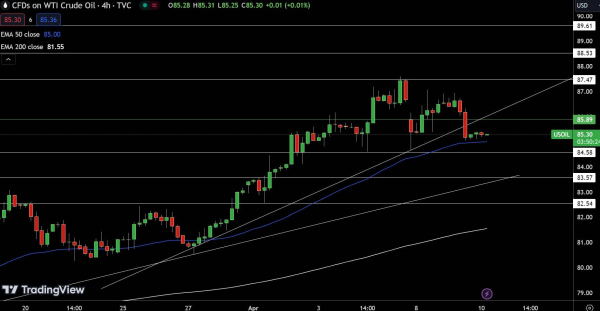
USOIL’s technical analysis reveals a stable market with minimal change, priced at $85.28. The critical pivot point is set at $85.89. Resistance levels are marked at $87.47, $88.53, and $89.61, indicating potential upward challenges.
Support lies at $84.58, $83.57, and $82.54, suggesting where price stabilization might occur. The 50-day EMA at $85.00 and 200-day EMA at $81.55 provide foundational support.
The presence of Doji candles signifies market indecision, yet maintaining above the EMAs could encourage buying. However, USOIL remains bearish below $85.90, with a break above possibly ushering in bullish momentum.
Brent Oil Price Forecast
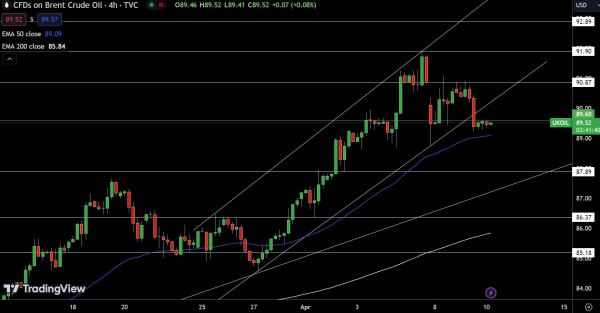
UKOIL is currently priced at $89.48, showing a slight decrease of 0.04%. The pivot point is at $89.60, with immediate resistance levels at $90.87, $91.90, and $92.89. Should UKOIL surpass these, it could indicate further upward momentum.
Support levels are set at $87.89, $86.37, and $85.18, where potential rebounds may occur. The 50-day EMA at $89.09 and the 200-day EMA at $85.84 provide additional context, suggesting a relatively stable market.
The current outlook is bullish above the $89.60 mark, yet a fall below this threshold could lead to a notable sell-off.
For a look at all of today’s economic events, check out our economic calendar.