Natural Gas and Oil Forecast: Oil Dips Over 3% as Middle East Tensions Ease
Market Overview
Oil prices have stabilized following a 3% decline, with Brent crude at $87.59 per barrel and West Texas Intermediate (WTI) at $82.32, as fears of a broader Middle East conflict lessen. The market is adjusting to lower than expected fuel demand and growing U.S. oil inventories, signaling a potential downturn in economic activity, particularly in China.
Meanwhile, natural gas forecasts are indirectly affected by these developments, given the interconnected nature of energy markets. The reduced likelihood of a severe escalation between Israel and Iran is alleviating concerns about supply disruptions from a key oil-producing region.
Analysts note that global oil consumption is trailing predictions, with a significant reduction in expected demand growth since the start of the year.
Natural Gas Price Forecast
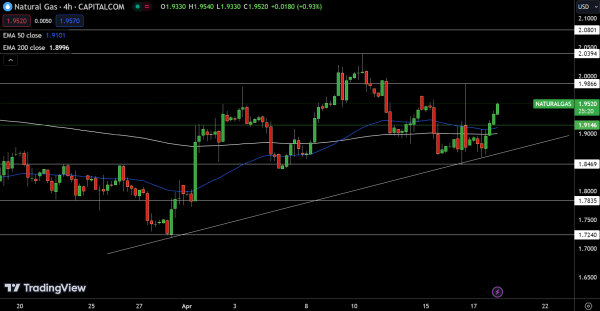
Natural Gas (NG) prices today have climbed to $1.9520, marking an increase of 1.72%. The commodity is trading above its pivot point at $1.91, indicating a bullish stance in the short term. Resistance levels are mapped out at $1.99, $2.04, and $2.08.
Conversely, should downward pressure emerge, support can be found at $1.85, followed by $1.78 and $1.72. The technical setup is reinforced by the 50-day Exponential Moving Average (EMA) at $1.91 and the 200-day EMA closely aligned at $1.90, supporting the current price.
A move below $1.91 could trigger a significant sell-off, suggesting a critical watch point for traders.
WTI Oil Price Forecast
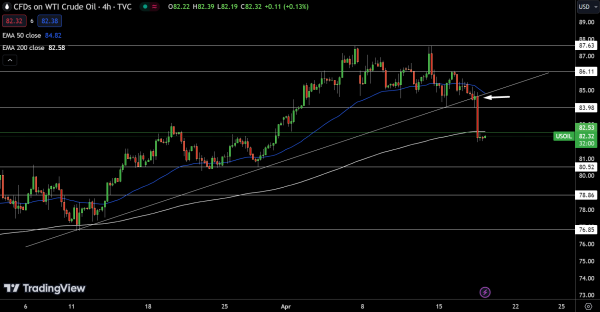
USOIL sees a slight increase today, trading at $82.32, up by 0.04%. Positioned close to its pivot point at $82.53, the market might be at a critical juncture. Resistance levels are set at $83.98, $86.11, and $87.63, while support figures are $80.52, followed by $78.86 and $76.85.
The RSI suggests neutral momentum. With the 50-day EMA at $84.82 and the 200-day EMA at $82.58, there’s a slight bearish undertone. Should prices fall below $82.53, a significant sell-off could be triggered.
Brent Oil Price Forecast
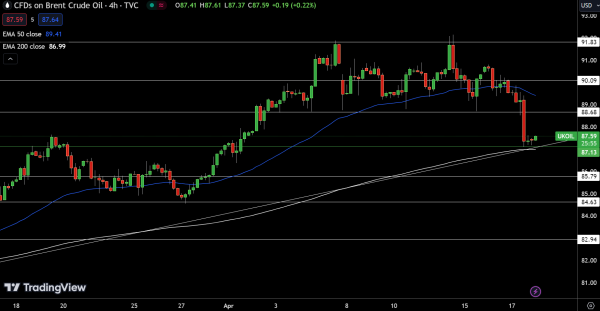
UKOIL has edged up today, posting a modest increase to $87.59, marking a gain of 0.17%. The commodity currently trades just above its pivot point of $87.13. Looking ahead, resistance levels are noted at $88.68, $90.09, and $91.83. On the downside, support is found at $85.79, with further levels at $84.63 and $82.94.
Technical indicators reveal a bullish sentiment above the pivot, underscored by the 50-day EMA at $89.41, suggesting potential resistance, and the 200-day EMA at $86.99, indicating strong underlying support. A drop below $87.13 could trigger a marked sell-off, shifting the market trend.
For a look at all of today’s economic events, check out our economic calendar.