Natural Gas and Oil Forecast: Oil to Exhibit Buying Opportunity Today
Market Overview
Oil prices fell over $1 per barrel as tensions in the Middle East subsided, with Brent dropping below $90. This decrease followed Israel’s partial troop withdrawal from Gaza and its engagement in ceasefire discussions, tempering fears of supply disruptions that had previously spiked oil prices.
Meanwhile, natural gas forecasts are impacted by the reduction in U.S. gas rigs, hinting at a potential tightening in supply.
The market is closely monitoring geopolitical developments and economic indicators, including U.S. and China consumer price index data, to assess future Federal Reserve rate decisions and their influence on global energy markets.
Natural Gas Price Forecast
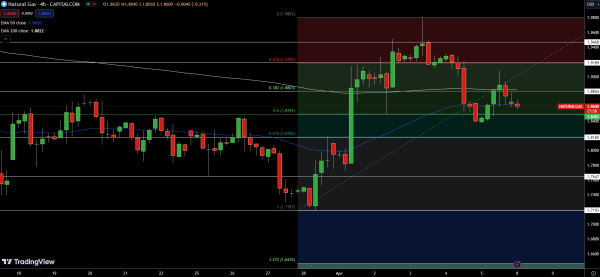
Natural Gas (NG) is currently priced at $1.86, reflecting a minor decline of 0.69%. The pivot point is at $1.85, with resistance levels identified at $1.88, $1.92, and $1.95. Support levels are at $1.82, $1.76, and $1.72.
The 50-day Exponential Moving Average (EMA) stands at $1.86, closely aligned with the current price, while the 200-day EMA is slightly higher at $1.88. These indicators suggest a balanced market stance.
However, NG shows a bullish trend if it remains above the $1.85 pivot. A fall below this critical level could initiate a notable downward trend.
WTI Oil Price Forecast
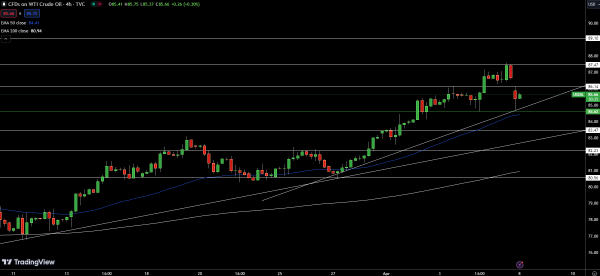
USOIL is currently trading at $85.66, marking a decrease of 1.34%. The pivot point stands at $84.62, with resistance levels at $86.14, $87.47, and $89.10. Support levels are identified at $83.47, $82.23, and $80.56.
The 50-day Exponential Moving Average (EMA) is at $84.41, and the 200-day EMA is at $80.94, indicating potential support levels.
The overall market trend for USOIL appears bullish above the pivot point of $84.62, yet a descent below this level could initiate a significant downward movement.
Brent Oil Price Forecast
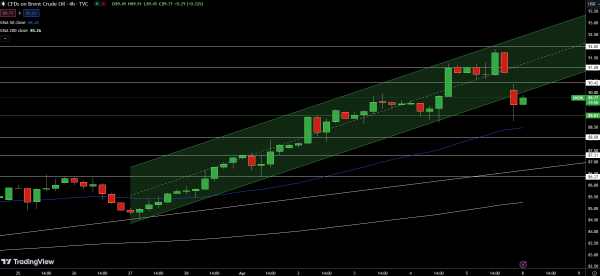
UKOIL stands at $89.77, showing a 1.34% decline. The pivot point is at $89.01, with resistance levels at $90.42, $91.08, and $92.00. Support is found at $88.08, $87.31, and $86.37.
The 50-day Exponential Moving Average (EMA) is at $88.48, while the 200-day EMA sits at $85.26, suggesting foundational support levels.
The market trend for UKOIL is bullish above the $89.01 pivot. However, a fall below this mark could precipitate a notable bearish movement.
For a look at all of today’s economic events, check out our economic calendar.