Natural Gas and Oil Forecast: Tensions Spike Prices; Will Oil Stay Bullish?
Market Overview
Oil prices experienced a slight increase in Asian trading on Friday, positioning for a weekly gain amidst continuous geopolitical tensions in the Middle East and expectations of tighter supply. However, the gains were modest as the market awaits crucial U.S. inflation data, which will provide further insights into potential interest rate movements.
The drop in the U.S. dollar, driven by disappointing U.S. economic growth figures, also provided some support to oil prices. The natural gas and oil forecast remains influenced by these dynamics, with reduced U.S. inventories indicating tighter oil markets and ongoing Middle East conflicts maintaining a risk premium on oil prices.
The upcoming U.S. PCE price index data, a key indicator for the Federal Reserve’s rate decisions, is expected to have significant implications for future pricing and demand in the energy sector.
Natural Gas Price Forecast
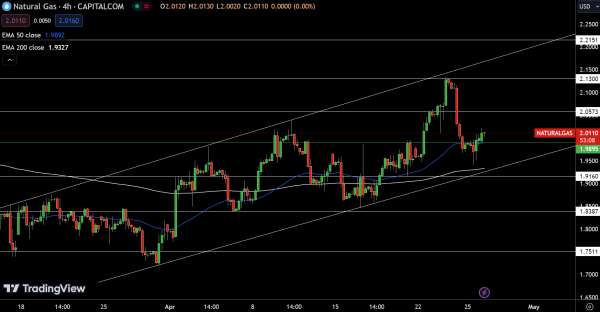
As of April 26, the Natural Gas (NG) market is experiencing a modest uptick, with the price rising to $2.01, marking a 0.65% increase. This movement is supported by a solid foundation at the pivot point of $1.99, which also coincides with the 50-Day Exponential Moving Average (EMA). Immediate resistance is found at $2.06, with subsequent levels at $2.13 and $2.22 suggesting potential upward momentum if these thresholds are surpassed.
Conversely, support levels are positioned significantly lower, with immediate support at $1.92, followed by $1.84 and then $1.75. The 200-Day EMA at $1.93 aligns closely with the first support level, reinforcing its importance. The technical indicators, with the EMA values and current price trends, suggest a bullish outlook for NG as long as it remains above $1.99.
WTI Oil Price Forecast
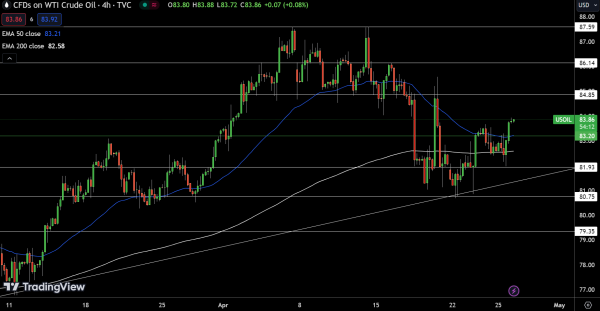
As of April 26, US crude oil (USOIL) is showing subtle positive movement, with the price at $83.85, a 0.13% increase. Positioned just above the pivot point of $83.20, which closely aligns with the 50-Day Exponential Moving Average (EMA) of $83.21, the current pricing indicates a potential foothold for further advances.
Immediate resistance levels are observed at $84.85, with more substantial barriers at $86.14 and $87.59 that could test the bullish momentum.
Support levels are set lower with initial support at $81.93, followed by $80.75 and $79.35. The 200-Day EMA at $82.58 bolsters the first support level, underscoring its significance. The technical setup suggests a bullish outlook as long as prices stay above $83.20.
Brent Oil Price Forecast
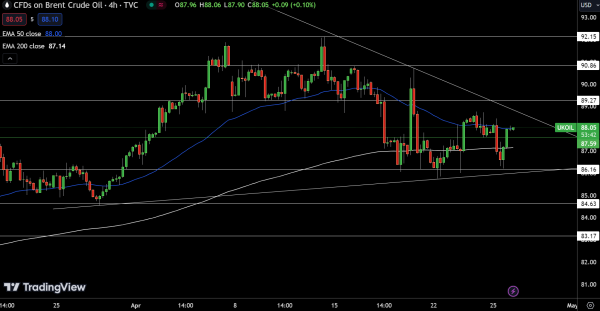
UK crude oil (UKOIL) recorded a modest increase, with the price reaching $88.04, up by 0.07%. The commodity is trading slightly above its pivotal level of $87.59, which is underscored by the 50-Day Exponential Moving Average (EMA) at $88.00. This close proximity to the EMA highlights a potential stabilizing factor for the price.
Looking ahead, UKOIL faces immediate resistance at $89.27, with further hurdles at $90.86 and $92.15 that could challenge the upward trend.
Conversely, support levels are positioned at $86.16, $84.63, and $83.17, with the 200-Day EMA at $87.14 providing additional foundational support. The technical indicators suggest a bullish outlook if prices remain above the pivot point of $87.59.
For a look at all of today’s economic events, check out our economic calendar.