Natural Gas and Oil Forecast: U.S. Inventory Surge Pressures Prices; Sell Now
Market Overview
Oil prices fell on Monday as the potential for escalated conflict between Israel and Iran diminished, leading to a reduction in the geopolitical risk premium that had briefly driven prices higher. Analysts noted that Iran’s muted response to Israel’s minor strike and reassurances against retaliation have cooled fears of immediate supply disruptions.
Additionally, a significant increase in U.S. crude inventories, which nearly doubled expectations, put further pressure on oil prices. The large stockpile build and a strong U.S. dollar, supported by a hawkish Federal Reserve stance, are contributing to bearish conditions in the crude market.
This market environment is expected to also influence natural gas forecasts, maintaining volatility as geopolitical and economic factors continue to interplay.Natural Gas Price Forecast
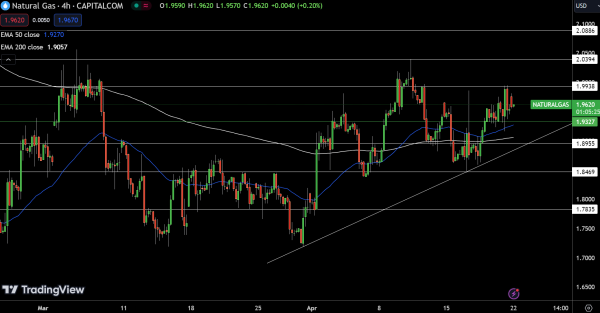
Today’s technical analysis of Natural Gas (NG) reveals a modest uptick in its price to $1.962, marking a 0.31% increase. The commodity currently hovers around the pivot point of $1.93, suggesting a potential for upward momentum if it maintains above this level.
Resistance levels to watch are at $1.99, $2.04, and $2.09, which could limit further gains. Conversely, NG finds immediate support at $1.90, with further downside protection at $1.85 and $1.78.
The 50-day and 200-day Exponential Moving Averages, at $1.93 and $1.91 respectively, align closely with current prices, indicating that NG is at a critical juncture. The overall outlook is cautiously optimistic above $1.93, but a drop below could trigger a sharper decline.
WTI Oil Price Forecast
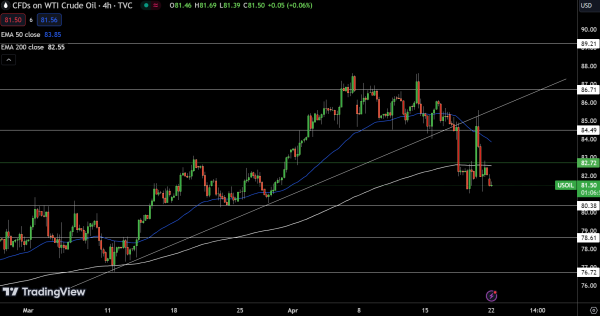
USOIL is priced at $81.50, reflecting a 0.68% decrease. The market is currently positioned below the pivot point of $82.72, suggesting a bearish sentiment. Resistance levels are observed at $84.49, $86.71, and $89.21, which could cap upward movements if reached. .
Conversely, support levels are found at $80.38, $78.61, and $76.72, potentially halting further declines. Technical indicators reveal a challenging outlook: the 50-day Exponential Moving Average (EMA) at $83.85 and the 200-day EMA at $82.55 provide critical thresholds.
The market stance is bearish below $82.72, with potential for a shift to a bullish bias should it breach this level.
Brent Oil Price Forecast
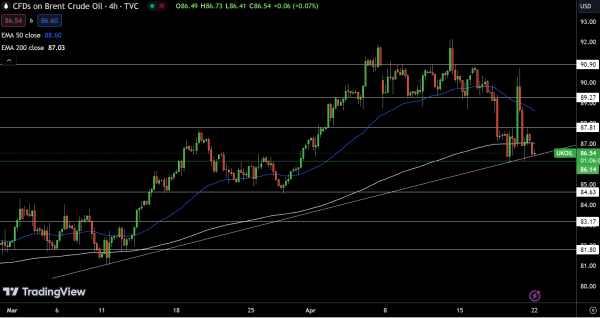
Brent Oil (UKOIL) shows a decline of 0.70%, with the commodity priced at $86.54. The current pivot point is established at $86.14, indicating a potentially pivotal moment for future price movements. Resistance levels are marked at $87.81, $89.27, and $90.90, which could cap upward trends.
On the downside, support is found at $84.63, followed by stronger floors at $83.17 and $81.80, which may provide a buffer against further declines.
The 50-day and 200-day Exponential Moving Averages stand at $88.60 and $87.03, respectively, suggesting a near-term bearish bias unless the price can sustain a break above the pivot point.
For a look at all of today’s economic events, check out our economic calendar.